Yahoo 2006 Annual Report Download - page 49
Download and view the complete annual report
Please find page 49 of the 2006 Yahoo annual report below. You can navigate through the pages in the report by either clicking on the pages listed below, or by using the keyword search tool below to find specific information within the annual report.-
 1
1 -
2
-
3
-
4
-
5
-
6
-
7
-
8
-
9
-
10
-
11
-
12
-
13
-
14
-
15
-
16
-
17
-
18
-
19
-
20
-
21
-
22
-
23
-
24
-
25
-
26
-
27
-
28
-
29
-
30
-
31
-
32
-
33
-
34
-
35
-
36
-
37
-
38
-
 39
39 -
 40
40 -
 41
41 -
 42
42 -
 43
43 -
 44
44 -
 45
45 -
 46
46 -
 47
47 -
 48
48 -
 49
49 -
 50
50 -
 51
51 -
 52
52 -
 53
53 -
 54
54 -
 55
55 -
 56
56 -
 57
57 -
 58
58 -
 59
59 -
60
-
61
-
62
-
63
-
64
-
65
-
66
-
67
-
68
-
69
-
70
-
71
-
72
-
73
-
74
-
75
-
76
-
77
-
78
-
79
-
80
-
81
-
82
-
83
-
84
-
85
-
86
-
87
-
88
-
89
-
90
-
91
-
92
-
93
-
94
-
95
-
96
-
97
-
98
-
99
-
100
-
101
-
102
-
103
-
104
-
105
-
106
-
107
-
108
-
109
-
110
-
111
-
112
-
113
-
114
-
115
-
116
-
117
-
118
-
119
-
120
-
121
-
122
-
123
-
124
-
125
-
126
 |
 |

in the online advertising market. We also currently expect fees revenue to increase in absolute dollars for 2007
compared to 2006 as we expect to increase our number of paying users in 2007.
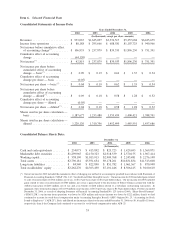
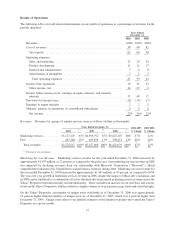
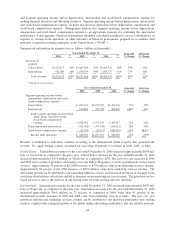
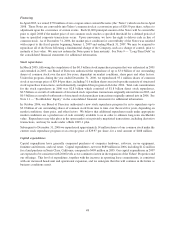
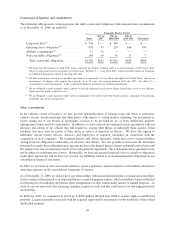
Costs and Expenses: Operating costs and expenses were as follows (dollars in thousands):
2004
(1)
2005
(1)
2006
(2) (1)
2004-2005
% Change
2005-2006
% Change
(2)
Years Ended December 31,
Cost of revenues
(3)
........... $1,342,338 38% $2,096,201 40% $2,675,723 42% 56% 28%
Sales and marketing .......... $ 787,649 22% $1,033,947 20% $1,322,259 20% 31% 28%
Product development ......... $ 380,770 11% $ 569,527 11% $ 833,147 13% 50% 46%
General and administrative ..... $ 273,262 7% $ 341,073 6% $ 528,798 8% 25% 55%
Amortization of intangibles
(3)
. . . $ 101,917 3% $ 109,195 2% $ 124,786 2% 7% 14%
(1)
Percent of total revenues.
(2)
Effective January 1, 2006, we adopted SFAS 123R and recorded stock-based compensation expense under the fair value method. Prior to
January 1, 2006, we accounted for stock-based compensation under Accounting Principles Board (“APB”) Opinion No. 25, “Accounting for
Stock Issued to Employees” (“APB 25”) and used the intrinsic value method. In the year ended December 31, 2006, we recorded
$425 million of stock-based compensation expense compared to $52 million and $32 million for the years ended December 31, 2005 and
2004, respectively. Stock-based compensation expense is included in the same income statement category as the cash compensation paid to
the recipient of the stock-based award.
(3)
For the years ended December 31, 2006, 2005 and 2004 cost of revenues included amortization expense of $113 million, $64 million, and
$44 million, respectively, relating to acquired intellectual property rights and developed technology.
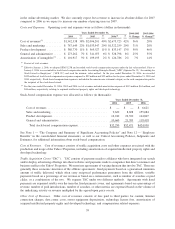
Stock-based compensation expense was allocated as follows (in thousands):
2004 2005 2006
Years Ended December 31,
Cost of revenues ..................................... $ — $ — $ 6,621
Sales and marketing ................................... 9,620 8,698 155,084
Product development .................................. 12,010 22,390 144,807
General and administrative . ............................. 10,660 21,383 118,418
Total stock-based compensation expense .................. $32,290 $52,471 $424,930
See Note 1 — “The Company and Summary of Significant Accounting Policies” and Note 12 — “Employee
Benefits” in the consolidated financial statements, as well as our Critical Accounting Policies, Judgments and
Estimates, for additional information about stock-based compensation.
Cost of Revenues. Cost of revenues consists of traffic acquisition costs and other expenses associated with the
production and usage of the Yahoo! Properties, including amortization of acquired intellectual property rights and
developed technology.
Traffic Acquisition Costs (“TAC”). TAC consists of payments made to affiliates who have integrated our search
and/or display advertising offerings into their websites and payments made to companies that direct consumer and
business traffic to the Yahoo! Properties. We enter into agreements of varying duration that involve TAC. There are
generally three economic structures of the affiliate agreements: fixed payments based on a guaranteed minimum
amount of traffic delivered, which often carry reciprocal performance guarantees from the affiliate; variable
payments based on a percentage of our revenue or based on a certain metric, such as number of searches or paid
clicks; or a combination of the two. We expense TAC under two different methods. Agreements with fixed
payments are expensed ratably over the term the fixed payment covers, and agreements based on a percentage of
revenue, number of paid introductions, number of searches, or other metrics are expensed based on the volume of
the underlying activity or revenue multiplied by the agreed-upon price or rate.
Other Cost of Revenues. Other cost of revenues consists of fees paid to third parties for content, Internet
connection charges, data center costs, server equipment depreciation, technology license fees, amortization of
acquired intellectual property rights and developed technology, and compensation related expenses.
39