Yahoo 2006 Annual Report Download - page 52
Download and view the complete annual report
Please find page 52 of the 2006 Yahoo annual report below. You can navigate through the pages in the report by either clicking on the pages listed below, or by using the keyword search tool below to find specific information within the annual report.-
 1
1 -
2
-
3
-
4
-
5
-
6
-
7
-
8
-
9
-
10
-
11
-
12
-
13
-
14
-
15
-
16
-
17
-
18
-
19
-
20
-
21
-
22
-
23
-
24
-
25
-
26
-
27
-
28
-
29
-
30
-
31
-
32
-
33
-
34
-
35
-
36
-
37
-
38
-
39
-
40
-
41
-
 42
42 -
 43
43 -
 44
44 -
 45
45 -
 46
46 -
 47
47 -
 48
48 -
 49
49 -
 50
50 -
 51
51 -
 52
52 -
 53
53 -
 54
54 -
 55
55 -
 56
56 -
 57
57 -
 58
58 -
 59
59 -
 60
60 -
 61
61 -
 62
62 -
63
-
64
-
65
-
66
-
67
-
68
-
69
-
70
-
71
-
72
-
73
-
74
-
75
-
76
-
77
-
78
-
79
-
80
-
81
-
82
-
83
-
84
-
85
-
86
-
87
-
88
-
89
-
90
-
91
-
92
-
93
-
94
-
95
-
96
-
97
-
98
-
99
-
100
-
101
-
102
-
103
-
104
-
105
-
106
-
107
-
108
-
109
-
110
-
111
-
112
-
113
-
114
-
115
-
116
-
117
-
118
-
119
-
120
-
121
-
122
-
123
-
124
-
125
-
126
 |
 |

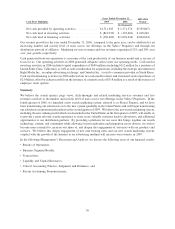
We currently believe that general and administrative expenses in absolute dollars will increase in 2007 compared to
2006, as we continue to invest in our infrastructure to support our continued business expansion.
Amortization of Intangibles. We have purchased, and expect to continue purchasing, assets or businesses, which
may include the purchase of intangible assets. Amortization of acquired intellectual property rights and developed
technology is included in the cost of revenues and not in amortization of intangibles. Amortization of intangibles
was approximately $125 million, or 2 percent of revenues for the year ended December 31, 2006, compared to
$109 million or 2 percent of revenues for 2005 and $102 million or 3 percent of revenues for 2004. The year over
year increases in amortization of intangibles reflected our continued acquisition activity resulting in increased
amortizable intangible assets, which were partially offset by declining amortization expenses due to intangible
assets that became fully amortized during the year. As of December 31, 2006, we had net intangible assets of
$406 million on our consolidated balance sheets.
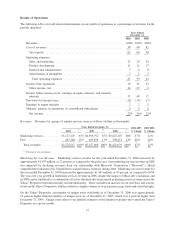
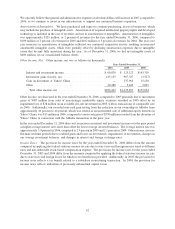
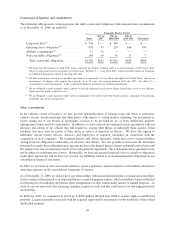
Other Income, Net. Other income, net was as follows (in thousands):
2004 2005 2006
Years Ended December 31,
Interest and investment income ....................... $ 60,830 $ 125,122 $143,310
Investment gains (losses), net ......................... 415,125 967,327 (3,527)
Gain on divestiture of Yahoo! China ................... — 337,965 15,158
Other .......................................... 20,488 5,443 2,093
Total other income, net ........................... $496,443 $1,435,857 $157,034
Other income, net decreased in the year ended December 31, 2006, compared to 2005 primarily due to investment
gains of $987 million from sales of non-strategic marketable equity securities recorded in 2005 offset by an
impairment loss of $28 million on an available-for-sale investment in 2005, with no transactions of comparable size
in 2006. Additionally, our recorded non-cash gain arising from the reduction in our ownership in Alibaba from
approximately 46 percent to 44 percent, which was treated as an incremental sale of additional equity interests in
Yahoo! China, was $15 million in 2006, compared to a non-cash gain of $338 million recorded from the divesture of
Yahoo! China in connection with the Alibaba transaction in the prior year.
In the year ended December 31, 2006 there was an increase in interest and investment income over the prior period
as higher average interest rates more than offset the lower average invested balances. The average interest rate was
approximately 3.9 percent in 2006, compared to 2.9 percent in 2005 and 2.1 percent in 2004. Other income, net may
fluctuate in future periods due to realized gains and losses on investments, impairments of investments, changes in
our average investment balances, and changes in interest and foreign exchange rates.
Income Taxes. The provision for income taxes for the year ended December 31, 2006 differs from the amount
computed by applying the federal statutory income tax rate due to state taxes and foreign income taxed at different
rates and non-deductible stock-based compensation expense. The provisions for income taxes for the years ended
December 31, 2005 and 2004 differ from the amounts computed by applying the federal statutory income tax rate
due to state taxes and foreign losses for which no tax benefit was provided. Additionally, in 2005, the provision for
income taxes reflects a tax benefit related to a subsidiary restructuring transaction. In 2004, the provision for
income taxes reflects utilization of previously unbenefited capital losses.
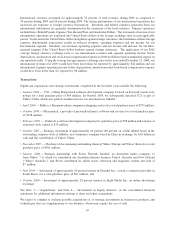
42