Yahoo 2006 Annual Report Download - page 92
Download and view the complete annual report
Please find page 92 of the 2006 Yahoo annual report below. You can navigate through the pages in the report by either clicking on the pages listed below, or by using the keyword search tool below to find specific information within the annual report.-
 1
1 -
2
-
3
-
4
-
5
-
6
-
7
-
8
-
9
-
10
-
11
-
12
-
13
-
14
-
15
-
16
-
17
-
18
-
19
-
20
-
21
-
22
-
23
-
24
-
25
-
26
-
27
-
28
-
29
-
30
-
31
-
32
-
33
-
34
-
35
-
36
-
37
-
38
-
39
-
40
-
41
-
42
-
43
-
44
-
45
-
46
-
47
-
48
-
49
-
50
-
51
-
52
-
53
-
54
-
55
-
56
-
57
-
58
-
59
-
60
-
61
-
62
-
63
-
64
-
65
-
66
-
67
-
68
-
69
-
70
-
71
-
72
-
73
-
74
-
75
-
76
-
77
-
78
-
79
-
80
-
81
-
 82
82 -
 83
83 -
 84
84 -
 85
85 -
 86
86 -
 87
87 -
 88
88 -
 89
89 -
 90
90 -
 91
91 -
 92
92 -
 93
93 -
 94
94 -
 95
95 -
 96
96 -
 97
97 -
 98
98 -
 99
99 -
 100
100 -
 101
101 -
 102
102 -
103
-
104
-
105
-
106
-
107
-
108
-
109
-
110
-
111
-
112
-
113
-
114
-
115
-
116
-
117
-
118
-
119
-
120
-
121
-
122
-
123
-
124
-
125
-
126
 |
 |

2005 2006
December 31,
Reported as:
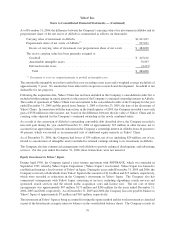
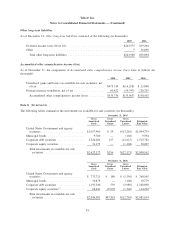
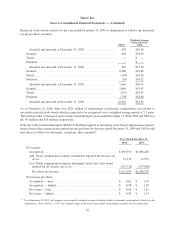
Marketable debt securities ................................. $1,131,141 $1,031,528
Long-term marketable debt securities ......................... 1,439,014 935,886
Other assets
(*)
.......................................... 30,007 114,220
(*)
Total ............................................... $2,600,162 $2,081,634
Available-for-sale securities included in cash and cash equivalents on the consolidated balance sheets are not
included in the table above as the gross unrealized gains and losses were immaterial for 2005 and 2006 with respect
to these securities.
(*)
These balances include our investment in Gmarket Inc. See Note 3 — “Acquisitions” for additional information.
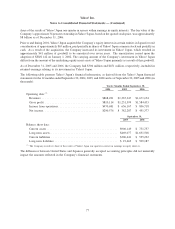
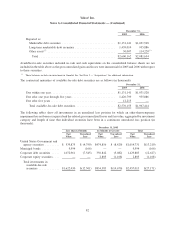
The contractual maturities of available-for-sale debt securities are as follows (in thousands):
2005 2006
December 31,
Due within one year ........................................ $1,131,141 $1,031,528
Due after one year through five years ........................... 1,426,799 935,886
Due after five years ........................................ 12,215 —
Total available-for-sale debt securities ......................... $2,570,155 $1,967,414
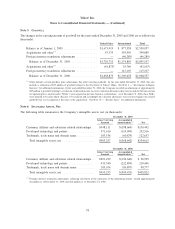
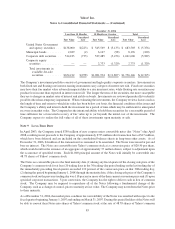
The following tables show all investments in an unrealized loss position for which an other-than-temporary
impairment has not been recognized and the related gross unrealized losses and fair value, aggregated by investment
category and length of time that individual securities have been in a continuous unrealized loss position (in
thousands):
Fair
Value
Unrealized
Loss
Fair
Value
Unrealized
Loss
Fair
Value
Unrealized
Loss
Less than 12 Months 12 Months or Greater Total
December 31, 2005
United States Government and
agency securities ......... $ 539,875 $ (4,790) $474,856 $ (8,420) $1,014,731 $(13,210)
Municipal bonds ........... 9,594 (166) — — 9,594 (166)
Corporate debt securities ..... 1,072,961 (7,545) 356,842 (5,082) 1,429,803 (12,627)
Corporate equity securities .... — — 2,885 (1,168) 2,885 (1,168)
Total investments in
available-for-sale
securities ............. $1,622,430 $(12,501) $834,583 $(14,670) $2,457,013 $(27,171)
82
Yahoo! Inc.
Notes to Consolidated Financial Statements — (Continued)