Yahoo 2006 Annual Report Download - page 42
Download and view the complete annual report
Please find page 42 of the 2006 Yahoo annual report below. You can navigate through the pages in the report by either clicking on the pages listed below, or by using the keyword search tool below to find specific information within the annual report.-
 1
1 -
2
-
3
-
4
-
5
-
6
-
7
-
8
-
9
-
10
-
11
-
12
-
13
-
14
-
15
-
16
-
17
-
18
-
19
-
20
-
21
-
22
-
23
-
24
-
25
-
26
-
27
-
28
-
29
-
30
-
31
-
 32
32 -
 33
33 -
 34
34 -
 35
35 -
 36
36 -
 37
37 -
 38
38 -
 39
39 -
 40
40 -
 41
41 -
 42
42 -
 43
43 -
 44
44 -
 45
45 -
 46
46 -
 47
47 -
 48
48 -
 49
49 -
 50
50 -
 51
51 -
 52
52 -
53
-
54
-
55
-
56
-
57
-
58
-
59
-
60
-
61
-
62
-
63
-
64
-
65
-
66
-
67
-
68
-
69
-
70
-
71
-
72
-
73
-
74
-
75
-
76
-
77
-
78
-
79
-
80
-
81
-
82
-
83
-
84
-
85
-
86
-
87
-
88
-
89
-
90
-
91
-
92
-
93
-
94
-
95
-
96
-
97
-
98
-
99
-
100
-
101
-
102
-
103
-
104
-
105
-
106
-
107
-
108
-
109
-
110
-
111
-
112
-
113
-
114
-
115
-
116
-
117
-
118
-
119
-
120
-
121
-
122
-
123
-
124
-
125
-
126
 |
 |
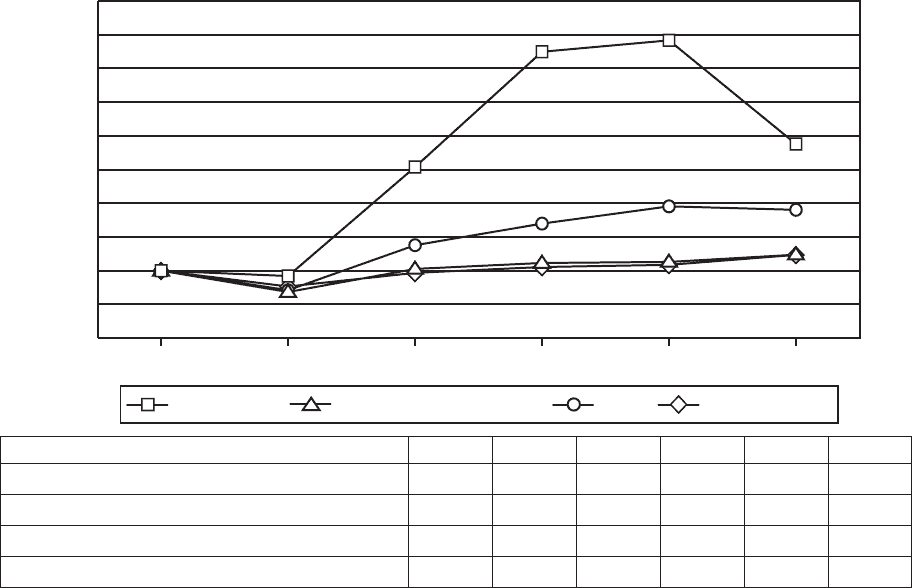
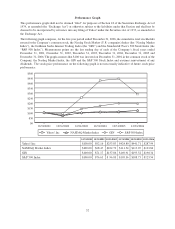
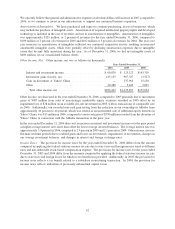
Performance Graph
This performance graph shall not be deemed “filed” for purposes of Section 18 of the Securities Exchange Act of
1934, as amended (the “Exchange Act”) or otherwise subject to the liabilities under that Section and shall not be
deemed to be incorporated by reference into any filing of Yahoo! under the Securities Act of 1933, as amended or
the Exchange Act.
The following graph compares, for the five year period ended December 31, 2006, the cumulative total stockholder
return for the Company’s common stock, the Nasdaq Stock Market (U.S. companies) Index (the “Nasdaq Market
Index”), the Goldman Sachs Internet Trading Index (the “GIN”) and the Standard & Poor’s 500 Stock Index (the
“S&P 500 Index”). Measurement points are the last trading day of each of the Company’s fiscal years ended
December 31, 2001, December 31, 2002, December 31, 2003, December 31, 2004, December 31, 2005 and
December 31, 2006. The graph assumes that $100 was invested on December 31, 2001 in the common stock of the
Company, the Nasdaq Market Index, the GIN and the S&P 500 Stock Index and assumes reinvestment of any
dividends. The stock price performance on the following graph is not necessarily indicative of future stock price
performance.
$0
$50
$100
$150
$200
$250
$300
$350
$400
$450
$500
12/31/200612/31/200512/31/200412/31/200312/31/200212/31/2001
Yahoo! Inc. NASDAQ Market Index GIN S&P 500 Index
12/31/2001 12/31/2002 12/31/2003 12/31/2004 12/31/2005 12/31/2006
Yahoo! Inc. $100.00 $92.16 $253.83 $424.80 $441.71 $287.94
NASDAQ Market Index $100.00 $68.47 $102.72 $111.54 $113.07 $123.84
GIN $100.00 $71.17 $137.86 $169.91 $195.52 $190.34
S&P 500 Index $100.00 $76.63 $ 96.85 $105.56 $108.73 $123.54
32