Yahoo 2006 Annual Report Download - page 67
Download and view the complete annual report
Please find page 67 of the 2006 Yahoo annual report below. You can navigate through the pages in the report by either clicking on the pages listed below, or by using the keyword search tool below to find specific information within the annual report.-
 1
1 -
2
-
3
-
4
-
5
-
6
-
7
-
8
-
9
-
10
-
11
-
12
-
13
-
14
-
15
-
16
-
17
-
18
-
19
-
20
-
21
-
22
-
23
-
24
-
25
-
26
-
27
-
28
-
29
-
30
-
31
-
32
-
33
-
34
-
35
-
36
-
37
-
38
-
39
-
40
-
41
-
42
-
43
-
44
-
45
-
46
-
47
-
48
-
49
-
50
-
51
-
52
-
53
-
54
-
55
-
56
-
 57
57 -
 58
58 -
 59
59 -
 60
60 -
 61
61 -
 62
62 -
 63
63 -
 64
64 -
 65
65 -
 66
66 -
 67
67 -
 68
68 -
 69
69 -
 70
70 -
 71
71 -
 72
72 -
 73
73 -
 74
74 -
 75
75 -
 76
76 -
 77
77 -
78
-
79
-
80
-
81
-
82
-
83
-
84
-
85
-
86
-
87
-
88
-
89
-
90
-
91
-
92
-
93
-
94
-
95
-
96
-
97
-
98
-
99
-
100
-
101
-
102
-
103
-
104
-
105
-
106
-
107
-
108
-
109
-
110
-
111
-
112
-
113
-
114
-
115
-
116
-
117
-
118
-
119
-
120
-
121
-
122
-
123
-
124
-
125
-
126
 |
 |

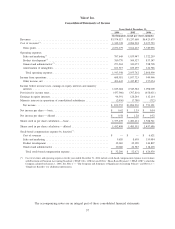
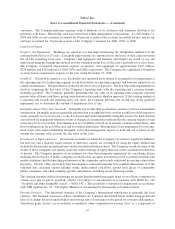
Yahoo! Inc.
Consolidated Statements of Income
2004 2005 2006
Years Ended December 31,
(In thousands, except per share amounts)
Revenues . . . . . . . . . . . . . . . . . . . . . . . . . . . . . . . . . . . . . . . . . . . . . . . . . . $3,574,517 $5,257,668 $6,425,679
Cost of revenues
(*)
. . . . . . . . . . . . . . . . . . . . . . . . . . . . . . . . . . . . . . . . . . . . 1,342,338 2,096,201 2,675,723
Gross profit . . . . . . . . . . . . . . . . . . . . . . . . . . . . . . . . . . . . . . . . . . . . . . . 2,232,179 3,161,467 3,749,956
Operating expenses:
Sales and marketing
(*)
. . . . . . . . . . . . . . . . . . . . . . . . . . . . . . . . . . . . . . . 787,649 1,033,947 1,322,259
Product development
(*)
. . . . . . . . . . . . . . . . . . . . . . . . . . . . . . . . . . . . . . . 380,770 569,527 833,147
General and administrative
(*)
. . . . . . . . . . . . . . . . . . . . . . . . . . . . . . . . . . . 273,262 341,073 528,798
Amortization of intangibles . . . . . . . . . . . . . . . . . . . . . . . . . . . . . . . . . . . . 101,917 109,195 124,786
Total operating expenses . . . . . . . . . . . . . . . . . . . . . . . . . . . . . . . . . . . . 1,543,598 2,053,742 2,808,990
Income from operations . . . . . . . . . . . . . . . . . . . . . . . . . . . . . . . . . . . . . . . . 688,581 1,107,725 940,966
Other income, net . . . . . . . . . . . . . . . . . . . . . . . . . . . . . . . . . . . . . . . . . . 496,443 1,435,857 157,034
Income before income taxes, earnings in equity interests and minority
interests . . . . . . . . . . . . . . . . . . . . . . . . . . . . . . . . . . . . . . . . . . . . . . . . . 1,185,024 2,543,582 1,098,000
Provision for income taxes . . . . . . . . . . . . . . . . . . . . . . . . . . . . . . . . . . . . . . (437,966) (767,816) (458,011)
Earnings in equity interests . . . . . . . . . . . . . . . . . . . . . . . . . . . . . . . . . . . . . . 94,991 128,244 112,114
Minority interests in operations of consolidated subsidiaries . . . . . . . . . . . . . . . (2,496) (7,780) (712)
Net income . . . . . . . . . . . . . . . . . . . . . . . . . . . . . . . . . . . . . . . . . . . . . . . $ 839,553 $1,896,230 $ 751,391
Net income per share — basic . . . . . . . . . . . . . . . . . . . . . . . . . . . . . . . . . . . . $ 0.62 $ 1.35 $ 0.54
Net income per share — diluted . . . . . . . . . . . . . . . . . . . . . . . . . . . . . . . . . . $ 0.58 $ 1.28 $ 0.52
Shares used in per share calculation — basic. . . . . . . . . . . . . . . . . . . . . . . . . . 1,353,439 1,400,421 1,388,741
Shares used in per share calculation — diluted . . . . . . . . . . . . . . . . . . . . . . . . 1,452,499 1,485,591 1,457,686
Stock-based compensation expense by function
(*)
:
Cost of revenues . . . . . . . . . . . . . . . . . . . . . . . . . . . . . . . . . . . . . . . . . . . $ — $ — $ 6,621
Sales and marketing . . . . . . . . . . . . . . . . . . . . . . . . . . . . . . . . . . . . . . . . . 9,620 8,698 155,084
Product development . . . . . . . . . . . . . . . . . . . . . . . . . . . . . . . . . . . . . . . . 12,010 22,390 144,807
General and administrative . . . . . . . . . . . . . . . . . . . . . . . . . . . . . . . . . . . . 10,660 21,383 118,418
Total stock-based compensation expense . . . . . . . . . . . . . . . . . . . . . . . . . $ 32,290 $ 52,471 $ 424,930
(*) Cost of revenues and operating expenses for the year ended December 31, 2006 include stock-based compensation expense in accordance
with Statement of Financial Accounting Standards (“SFAS”) No. 123R (revised 2004), “Share-Based Payment” (“SFAS 123R”), which the
Company adopted on January 1, 2006. See Note 1 — “The Company and Summary of Significant Accounting Policies” and Note 12 —
“Employee Benefits” for additional information.
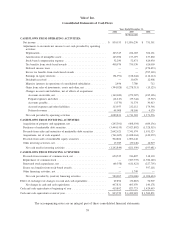
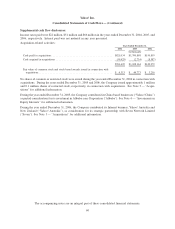
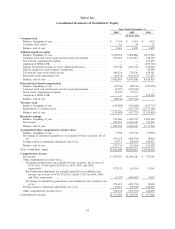
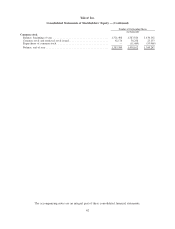
The accompanying notes are an integral part of these consolidated financial statements.
57