Yahoo 2006 Annual Report Download - page 110
Download and view the complete annual report
Please find page 110 of the 2006 Yahoo annual report below. You can navigate through the pages in the report by either clicking on the pages listed below, or by using the keyword search tool below to find specific information within the annual report.-
 1
1 -
2
-
3
-
4
-
5
-
6
-
7
-
8
-
9
-
10
-
11
-
12
-
13
-
14
-
15
-
16
-
17
-
18
-
19
-
20
-
21
-
22
-
23
-
24
-
25
-
26
-
27
-
28
-
29
-
30
-
31
-
32
-
33
-
34
-
35
-
36
-
37
-
38
-
39
-
40
-
41
-
42
-
43
-
44
-
45
-
46
-
47
-
48
-
49
-
50
-
51
-
52
-
53
-
54
-
55
-
56
-
57
-
58
-
59
-
60
-
61
-
62
-
63
-
64
-
65
-
66
-
67
-
68
-
69
-
70
-
71
-
72
-
73
-
74
-
75
-
76
-
77
-
78
-
79
-
80
-
81
-
82
-
83
-
84
-
85
-
86
-
87
-
88
-
89
-
90
-
91
-
92
-
93
-
94
-
95
-
96
-
97
-
98
-
99
-
 100
100 -
 101
101 -
 102
102 -
 103
103 -
 104
104 -
 105
105 -
 106
106 -
 107
107 -
 108
108 -
 109
109 -
 110
110 -
 111
111 -
 112
112 -
 113
113 -
 114
114 -
 115
115 -
 116
116 -
 117
117 -
 118
118 -
 119
119 -
 120
120 -
121
-
122
-
123
-
124
-
125
-
126
 |
 |

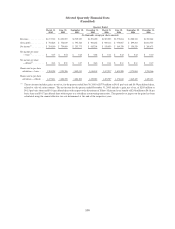
Selected Quarterly Financial Data
(Unaudited)
March 31,
2005
June 30,
2005
September 30,
2005
December 31,
2005
March 31,
2006
June 30,
2006
September 30,
2006
December 31,
2006
Quarters Ended
(In thousands, except per share amounts)
Revenues ........... $1,173,742 $1,252,997 $1,329,929 $1,501,000 $1,567,055 $1,575,854 $1,580,322 $1,702,448
Gross profit .......... $ 706,818 $ 752,839 $ 795,548 $ 906,262 $ 909,112 $ 930,087 $ 899,202 $1,011,555
Net income
(*)
......... $ 204,560 $ 754,689 $ 253,773 $ 683,208 $ 159,859 $ 164,330 $ 158,529 $ 268,673
Net income per share
— basic
(*)
......... $ 0.15 $ 0.54 $ 0.18 $ 0.48 $ 0.11 $ 0.12 $ 0.12 $ 0.20
Net income per share
— diluted
(*)
........ $ 0.14 $ 0.51 $ 0.17 $ 0.46 $ 0.11 $ 0.11 $ 0.11 $ 0.19
Shares used in per share
calculation — basic . . . . 1,384,958 1,395,596 1,405,012 1,416,118 1,417,917 1,405,598 1,375,884 1,355,566
Shares used in per share
calculation — diluted . . . 1,477,811 1,484,200 1,486,876 1,496,942 1,493,307 1,476,642 1,442,429 1,419,143
(*)
The net income includes gains, net of tax, for the quarter ended June 30, 2005 of $573 million or $0.41 per basic and $0.39 per diluted share,
related to sales of an investment. The net income for the quarter ended December 31, 2005 includes a gain, net of tax, of $205 million or
$0.15 per basic share and $0.14 per diluted share with respect to the divestiture of Yahoo! China and a tax benefit of $248 million or $0.18 per
basic share and $0.17 per diluted share with respect to a subsidiary restructuring transaction. The quarterly tax impact on the gains has been
calculated using the annual effective tax rate determined at the end of the respective years.
100