Yahoo 2006 Annual Report Download - page 56
Download and view the complete annual report
Please find page 56 of the 2006 Yahoo annual report below. You can navigate through the pages in the report by either clicking on the pages listed below, or by using the keyword search tool below to find specific information within the annual report.-
 1
1 -
2
-
3
-
4
-
5
-
6
-
7
-
8
-
9
-
10
-
11
-
12
-
13
-
14
-
15
-
16
-
17
-
18
-
19
-
20
-
21
-
22
-
23
-
24
-
25
-
26
-
27
-
28
-
29
-
30
-
31
-
32
-
33
-
34
-
35
-
36
-
37
-
38
-
39
-
40
-
41
-
42
-
43
-
44
-
45
-
 46
46 -
 47
47 -
 48
48 -
 49
49 -
 50
50 -
 51
51 -
 52
52 -
 53
53 -
 54
54 -
 55
55 -
 56
56 -
 57
57 -
 58
58 -
 59
59 -
 60
60 -
 61
61 -
 62
62 -
 63
63 -
 64
64 -
 65
65 -
 66
66 -
67
-
68
-
69
-
70
-
71
-
72
-
73
-
74
-
75
-
76
-
77
-
78
-
79
-
80
-
81
-
82
-
83
-
84
-
85
-
86
-
87
-
88
-
89
-
90
-
91
-
92
-
93
-
94
-
95
-
96
-
97
-
98
-
99
-
100
-
101
-
102
-
103
-
104
-
105
-
106
-
107
-
108
-
109
-
110
-
111
-
112
-
113
-
114
-
115
-
116
-
117
-
118
-
119
-
120
-
121
-
122
-
123
-
124
-
125
-
126
 |
 |

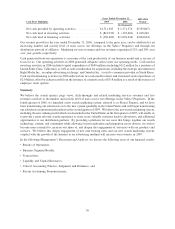
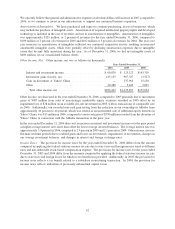
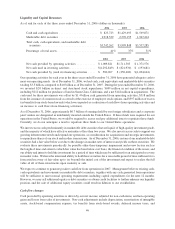
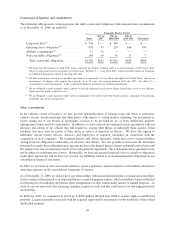
Liquidity and Capital Resources
As of and for each of the three years ended December 31, 2006 (dollars in thousands):
2004 2005 2006
Cash and cash equivalents ........................ $ 823,723 $1,429,693 $1,569,871
Marketable debt securities ........................ 2,918,539 2,570,155 1,967,414
Total cash, cash equivalents, and marketable debt
securities ................................... $3,742,262 $3,999,848 $3,537,285
Percentage of total assets ......................... 41% 37% 31%
2004 2005 2006
Net cash provided by operating activities ............ $1,089,821 $1,711,383 $ 1,371,576
Net cash used in investing activities ................ $(1,292,849) $ (821,930) $ (193,681)
Net cash provided by (used in) financing activities ..... $ 580,967 $ (250,600) $(1,094,624)
Our operating activities for each year in the three years ended December 31, 2006 have generated adequate cash to
meet our operating needs. As of December 31, 2006, we had cash, cash equivalents and marketable debt securities
totaling $3.5 billion, compared to $4.0 billion as of December 31, 2005. During the year ended December 31, 2006,
we invested $2.0 billion in direct and structured stock repurchases, $689 million in net capital expenditures,
including $112 million for purchase of land in Santa Clara, California, and a net $142 million in acquisitions. The
cash used for these investments was offset by $1.4 billion cash generated from operating activities, $318 million
from the issuance of common stock as a result of the exercise of employee stock options, and $597 million of excess
tax benefits from stock-based awards (which was reported as a reduction of cash flows from operating activities and
an increase to cash flows from financing activities).
As of December 31, 2006, approximately $0.7 billion of earnings held by our foreign subsidiaries and a corporate
joint venture are designated as indefinitely invested outside the United States. If these funds were required for our
operations in the United States, we would be required to accrue and pay additional taxes to repatriate these funds.
Currently, we do not anticipate a need to repatriate these funds to our United States operations.
We invest excess cash predominantly in marketable debt securities that are liquid, of high-quality investment grade,
and the majority of which have effective maturities of less than two years. We also invest excess cash to support our
growing infrastructure needs and expand our operations, as consideration for acquisitions and strategic investments,
to repurchase shares of our stock and in other transactions. As of December 31, 2006, certain of our marketable debt
securities had a fair value below cost due to the changes in market rates of interest and yields on these securities. We
evaluate these investments periodically for possible other-than-temporary impairment and review factors such as
the length of time and extent to which fair value has been below cost basis, the financial condition of the issuer, and
our ability and intent to hold the investment for a period of time which may be sufficient for an anticipated recovery
in market value. We have the intent and ability to hold these securities for a reasonable period of time sufficient for a
forecasted recovery of fair value up to (or beyond) the initial cost of the investment and expect to realize the full
value of all of these investments upon maturity or sale.
We expect to continue to generate positive cash flow from operations in 2007. Management believes existing cash,
cash equivalents and investments in marketable debt securities, together with any cash generated from operations
will be sufficient to meet normal operating requirements including capital expenditures for the next 12 months.
However, we may sell additional equity or debt securities or obtain credit facilities to further enhance our liquidity
position, and the sale of additional equity securities could result in dilution to our stockholders.
Cash flow changes
Cash provided by operating activities is driven by our net income, adjusted for non-cash items, and non-operating
gains and losses from sales of investments. Non-cash adjustments include depreciation, amortization of intangible
assets, stock-based compensation expense, tax benefits from stock-based awards, deferred income taxes, and
46