Yahoo 2006 Annual Report Download - page 91
Download and view the complete annual report
Please find page 91 of the 2006 Yahoo annual report below. You can navigate through the pages in the report by either clicking on the pages listed below, or by using the keyword search tool below to find specific information within the annual report.-
 1
1 -
2
-
3
-
4
-
5
-
6
-
7
-
8
-
9
-
10
-
11
-
12
-
13
-
14
-
15
-
16
-
17
-
18
-
19
-
20
-
21
-
22
-
23
-
24
-
25
-
26
-
27
-
28
-
29
-
30
-
31
-
32
-
33
-
34
-
35
-
36
-
37
-
38
-
39
-
40
-
41
-
42
-
43
-
44
-
45
-
46
-
47
-
48
-
49
-
50
-
51
-
52
-
53
-
54
-
55
-
56
-
57
-
58
-
59
-
60
-
61
-
62
-
63
-
64
-
65
-
66
-
67
-
68
-
69
-
70
-
71
-
72
-
73
-
74
-
75
-
76
-
77
-
78
-
79
-
80
-
 81
81 -
 82
82 -
 83
83 -
 84
84 -
 85
85 -
 86
86 -
 87
87 -
 88
88 -
 89
89 -
 90
90 -
 91
91 -
 92
92 -
 93
93 -
 94
94 -
 95
95 -
 96
96 -
 97
97 -
 98
98 -
 99
99 -
 100
100 -
 101
101 -
102
-
103
-
104
-
105
-
106
-
107
-
108
-
109
-
110
-
111
-
112
-
113
-
114
-
115
-
116
-
117
-
118
-
119
-
120
-
121
-
122
-
123
-
124
-
125
-
126
 |
 |

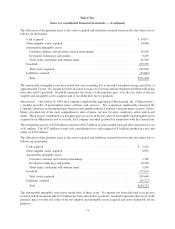
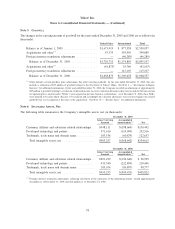
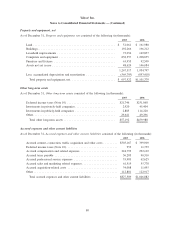
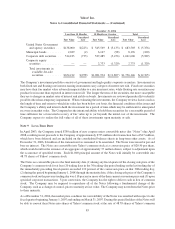
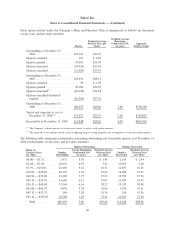
Other long-term liabilities
As of December 31, Other long-term liabilities consisted of the following (in thousands):
2005 2006
Deferred income taxes (Note 10) .................................. $243,575 $19,204
Other ...................................................... 5 36,890
Total other long-term liabilities ................................. $243,580 $56,094
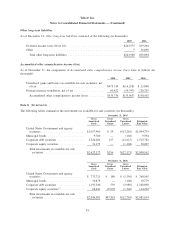
Accumulated other comprehensive income (loss)
As of December 31, the components of Accumulated other comprehensive income (loss) were as follows (in
thousands):
2004 2005 2006
Unrealized gains and losses on available-for-sale securities, net
oftax.......................................... $475,314 $(16,218) $ 21,800
Foreign currency translation, net of tax ................... 60,422 (19,747) 128,705
Accumulated other comprehensive income (loss) .......... $535,736 $(35,965) $150,505
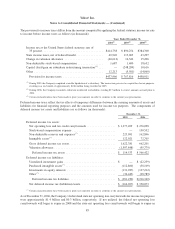
Note 8 INVESTMENTS
The following tables summarize the investments in available-for-sale securities (in thousands):
Gross
Amortized
Costs
Gross
Unrealized
Gains
Gross
Unrealized
Losses
Estimated
Fair Value
December 31, 2005
United States Government and agency
securities ........................... $1,057,960 $ 29 $(13,210) $1,044,779
Municipal bonds ....................... 9,760 — (166) 9,594
Corporate debt securities ................. 1,528,282 127 (12,627) 1,515,782
Corporate equity securities ................ 31,175 — (1,168) 30,007
Total investments in available-for-sale
securities ......................... $2,627,177 $156 $(27,171) $2,600,162
Gross
Amortized
Costs
Gross
Unrealized
Gains
Gross
Unrealized
Losses
Estimated
Fair Value
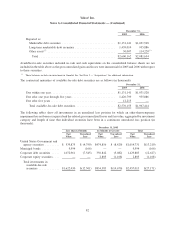
December 31, 2006
United States Government and agency
securities ........................... $ 773,721 $ 180 $ (5,356) $ 768,545
Municipal bonds ....................... 10,879 — (100) 10,779
Corporate debt securities ................. 1,193,540 539 (5,989) 1,188,090
Corporate equity securities
(*)
.............. 68,441 47,099 (1,320) 114,220
(*)
Total investments in available-for-sale
securities ......................... $2,046,581 $47,818 $(12,765) $2,081,634
81
Yahoo! Inc.
Notes to Consolidated Financial Statements — (Continued)