Electronic Arts 2009 Annual Report Download - page 109
Download and view the complete annual report
Please find page 109 of the 2009 Electronic Arts annual report below. You can navigate through the pages in the report by either clicking on the pages listed below, or by using the keyword search tool below to find specific information within the annual report.-
 1
1 -
2
-
3
-
4
-
5
-
6
-
7
-
8
-
9
-
10
-
11
-
12
-
13
-
14
-
15
-
16
-
17
-
18
-
19
-
20
-
21
-
22
-
23
-
24
-
25
-
26
-
27
-
28
-
29
-
30
-
31
-
32
-
33
-
34
-
35
-
36
-
37
-
38
-
39
-
40
-
41
-
42
-
43
-
44
-
45
-
46
-
47
-
48
-
49
-
50
-
51
-
52
-
53
-
54
-
55
-
56
-
57
-
58
-
59
-
60
-
61
-
62
-
63
-
64
-
65
-
66
-
67
-
68
-
69
-
70
-
71
-
72
-
73
-
74
-
75
-
76
-
77
-
78
-
79
-
80
-
81
-
82
-
83
-
84
-
85
-
86
-
87
-
88
-
89
-
90
-
91
-
92
-
93
-
94
-
95
-
96
-
97
-
98
-
 99
99 -
 100
100 -
 101
101 -
 102
102 -
 103
103 -
 104
104 -
 105
105 -
 106
106 -
 107
107 -
 108
108 -
 109
109 -
 110
110 -
 111
111 -
 112
112 -
 113
113 -
 114
114 -
 115
115 -
 116
116 -
 117
117 -
 118
118 -
 119
119 -
120
-
121
-
122
-
123
-
124
-
125
-
126
-
127
-
128
-
129
-
130
-
131
-
132
-
133
-
134
-
135
-
136
-
137
-
138
-
139
-
140
-
141
-
142
-
143
-
144
-
145
-
146
-
147
-
148
-
149
-
150
-
151
-
152
-
153
-
154
-
155
-
156
-
157
-
158
-
159
-
160
-
161
-
162
-
163
-
164
-
165
-
166
-
167
-
168
-
169
-
170
-
171
-
172
-
173
-
174
-
175
-
176
-
177
-
178
-
179
-
180
-
181
-
182
-
183
-
184
-
185
-
186
-
187
-
188
-
189
-
190
-
191
-
192
-
193
-
194
-
195
-
196
-
197
-
198
-
199
-
200
-
201
-
202
-
203
-
204
-
205
-
206
-
207
-
208
 |
 |

Annual Report
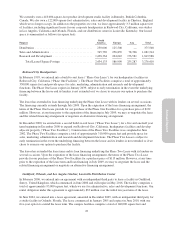
Financial Results
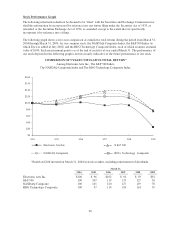
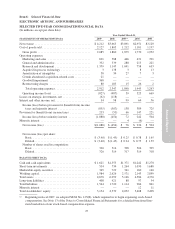
Total net revenue for the fiscal year ended March 31, 2009 was $4,212 million, up $547 million as compared to
the fiscal year ended March 31, 2008. At March 31, 2008, deferred net revenue associated with sales of online-
enabled packaged goods and digital content increased by $355 million as compared to March 31, 2007, directly
reducing the amount of reported net revenue during the year ended March 31, 2008. At March 31, 2009, deferred
net revenue associated with sales of online-enabled packaged goods and digital content decreased by $126
million as compared to March 31, 2008, directly increasing the amount of reported net revenue during the year
ended March 31, 2009. Without these changes in deferred net revenue, reported net revenue increased by
approximately $66 million during fiscal year 2009 as compared to fiscal year 2008. Fiscal year 2009 net revenue
was driven primarily by Rock Band 2 and Spore™.
Net loss for the fiscal year ended March 31, 2009 was $1,088 million as compared to a net loss of $454 million
for the fiscal year ended March 31, 2008. Diluted loss per share for the fiscal year ended March 31, 2009 was
$3.40 as compared to a diluted loss per share of $1.45 for the fiscal year ended March 31, 2008. Net loss
increased for fiscal year 2009 as compared to fiscal year 2008 primarily as a result of (1) the recognition of $368
million of goodwill impairment for our EA Mobile reporting unit, (2) recognition of $362 million related to an
increase in the valuation allowance for deferred tax assets, of which $232 million related to U.S. deferred tax
assets that existed as of our fiscal year ended March 31, 2008, (3) a $322 million increase in cost of goods sold,
and (4) a $317 million increase in research and development and marketing and sales costs. These were partially
offset by (1) an increase of $547 million in net revenue due to increased sales of our games and (2) a decrease of
$135 million in acquired in-process technology primarily due to our acquisition of VGH in 2008.
During fiscal year 2009, we generated $12 million of cash in operating activities as compared to generating $338
million for fiscal year 2008. The decrease in cash provided by operating activities for fiscal year 2009 as
compared to fiscal year 2008 was primarily due to an increase in external development costs, marketing and
advertising costs and personnel-related expenses.
Trends in Our Business
Economic Environment. As a result of the national and global economic downturn, overall consumer spending
has declined. Retailers globally have taken a more conservative stance in ordering game inventory. The decrease
in retail orders contributed to the decline in anticipated demand for our products during the 2008 holiday selling
season. We remain cautious about our future sales in light of the current economic environment and the impact it
has had on our retailers.
Current Generation Game Consoles. Video game hardware systems have historically had a life cycle of four to
six years, which causes the video game software market to be cyclical as well. The current cycle began with
Microsoft’s launch of the Xbox 360 in 2005, and continued in 2006 when Sony and Nintendo launched their
next-generation systems, the PLAYSTATION 3 and the Wii, respectively. Unlike past cycles, we believe this
current cycle may be extended, partly due to the growth of online services and content, and the greater graphic
and processing power of the current-generation hardware. As a result, we expect the growth in the installed base
of the Xbox 360, the PLAYSTATION 3 and the Wii to slow down as we enter the back half of this cycle.
Therefore, in light of the current economic environment and where we stand in the current generation console
cycle, our industry may experience slower growth than in recent years.
Online Content and Services. In addition to selling packaged goods games, we also provide a variety of
electronically delivered products and services. Many of our games that are available as packaged goods products
are also available by direct electronic download through the Internet (from websites that we maintain and others
that we license). We also offer electronically delivered content and services that are add-ons or related to our
packaged goods products (e.g., game enhancements or matchmaking services), and other games, content and
services that are available only via electronic delivery (such as games for wireless devices, and Internet-only
games and game services). Electronically delivered content and services are offered to consumers as subscription
services, electronic downloads for a one-time fee, or on an advertising-supported basis. We have made
29