Electronic Arts 2009 Annual Report Download - page 186
Download and view the complete annual report
Please find page 186 of the 2009 Electronic Arts annual report below. You can navigate through the pages in the report by either clicking on the pages listed below, or by using the keyword search tool below to find specific information within the annual report.-
 1
1 -
2
-
3
-
4
-
5
-
6
-
7
-
8
-
9
-
10
-
11
-
12
-
13
-
14
-
15
-
16
-
17
-
18
-
19
-
20
-
21
-
22
-
23
-
24
-
25
-
26
-
27
-
28
-
29
-
30
-
31
-
32
-
33
-
34
-
35
-
36
-
37
-
38
-
39
-
40
-
41
-
42
-
43
-
44
-
45
-
46
-
47
-
48
-
49
-
50
-
51
-
52
-
53
-
54
-
55
-
56
-
57
-
58
-
59
-
60
-
61
-
62
-
63
-
64
-
65
-
66
-
67
-
68
-
69
-
70
-
71
-
72
-
73
-
74
-
75
-
76
-
77
-
78
-
79
-
80
-
81
-
82
-
83
-
84
-
85
-
86
-
87
-
88
-
89
-
90
-
91
-
92
-
93
-
94
-
95
-
96
-
97
-
98
-
99
-
100
-
101
-
102
-
103
-
104
-
105
-
106
-
107
-
108
-
109
-
110
-
111
-
112
-
113
-
114
-
115
-
116
-
117
-
118
-
119
-
120
-
121
-
122
-
123
-
124
-
125
-
126
-
127
-
128
-
129
-
130
-
131
-
132
-
133
-
134
-
135
-
136
-
137
-
138
-
139
-
140
-
141
-
142
-
143
-
144
-
145
-
146
-
147
-
148
-
149
-
150
-
151
-
152
-
153
-
154
-
155
-
156
-
157
-
158
-
159
-
160
-
161
-
162
-
163
-
164
-
165
-
166
-
167
-
168
-
169
-
170
-
171
-
172
-
173
-
174
-
175
-
 176
176 -
 177
177 -
 178
178 -
 179
179 -
 180
180 -
 181
181 -
 182
182 -
 183
183 -
 184
184 -
 185
185 -
 186
186 -
 187
187 -
 188
188 -
 189
189 -
 190
190 -
 191
191 -
 192
192 -
 193
193 -
 194
194 -
 195
195 -
 196
196 -
197
-
198
-
199
-
200
-
201
-
202
-
203
-
204
-
205
-
206
-
207
-
208
 |
 |

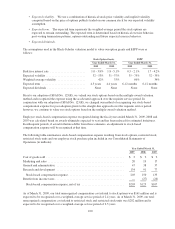
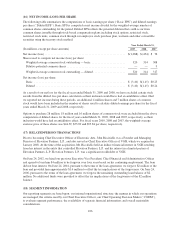
(16) NET INCOME (LOSS) PER SHARE
The following table summarizes the computations of basic earnings per share (“Basic EPS”) and diluted earnings
per share (“Diluted EPS”). Basic EPS is computed as net income divided by the weighted-average number of
common shares outstanding for the period. Diluted EPS reflects the potential dilution that could occur from
common shares issuable through stock-based compensation plans including stock options, restricted stock,
restricted stock units, common stock through our employee stock purchase plan, warrants and other convertible
securities using the treasury stock method.
Year Ended March 31,
(In millions, except per share amounts) 2009 2008 2007
Net income (loss) ....................................................... $(1,088) $ (454) $ 76
Shares used to compute net income (loss) per share:
Weighted-average common stock outstanding — basic ....................... 320 314 308
Dilutive potential common shares ........................................ — — 9
Weighted-average common stock outstanding — diluted ...................... 320 314 317
Net income (loss) per share:
Basic .............................................................. $ (3.40) $(1.45) $0.25
Diluted ............................................................. $ (3.40) $(1.45) $0.24
As a result of our net loss for the fiscal years ended March 31, 2009 and 2008, we have excluded certain stock
awards from the diluted loss per share calculation as their inclusion would have had an antidilutive effect. Had
we reported net income during these periods, an additional 4 million shares and 7 million shares of common
stock would have been included in the number of shares used to calculate diluted earnings per share for the fiscal
years ended March 31, 2009 and 2008, respectively.
Options to purchase 28 million, 18 million and 16 million shares of common stock were excluded from the above
computation of diluted shares for the fiscal years ended March 31, 2009, 2008 and 2007, respectively, as their
inclusion would have had an antidilutive effect. For fiscal years 2009, 2008 and 2007, the weighted-average
exercise price of these shares was $44.59, $53.89 and $55.84 per share, respectively.
(17) RELATED PERSON TRANSACTIONS
Prior to becoming Chief Executive Officer of Electronic Arts, John Riccitiello was a Founder and Managing
Director of Elevation Partners, L.P., and also served as Chief Executive Officer of VGH, which we acquired in
January 2008. At the time of the acquisition, Mr. Riccitiello held an indirect financial interest in VGH resulting
from his interest in the entity that controlled Elevation Partners, L.P. and his interest in a limited partner of
Elevation Partners, L.P. Elevation Partners, L.P. was a significant stockholder of VGH.
On June 24, 2002, we hired our previous Executive Vice President, Chief Financial and Administrative Officer
and agreed to loan him $4 million to be forgiven over four years based on his continuing employment. The loan
did not bear interest. On June 24, 2004, pursuant to the terms of the loan agreement, we forgave $2 million of the
loan and provided him approximately $1.6 million to offset the tax implications of the forgiveness. On June 24,
2006, pursuant to the terms of the loan agreement, we forgave the remaining outstanding loan balance of $2
million. No additional funds were provided to offset the tax implications of the forgiveness of the $2 million
balance.
(18) SEGMENT INFORMATION
Our reporting segments are based upon: our internal organizational structure; the manner in which our operations
are managed; the criteria used by our Chief Executive Officer, our Chief Operating Decision Maker (“CODM”),
to evaluate segment performance; the availability of separate financial information; and overall materiality
considerations.
106