Electronic Arts 2009 Annual Report Download - page 158
Download and view the complete annual report
Please find page 158 of the 2009 Electronic Arts annual report below. You can navigate through the pages in the report by either clicking on the pages listed below, or by using the keyword search tool below to find specific information within the annual report.-
 1
1 -
2
-
3
-
4
-
5
-
6
-
7
-
8
-
9
-
10
-
11
-
12
-
13
-
14
-
15
-
16
-
17
-
18
-
19
-
20
-
21
-
22
-
23
-
24
-
25
-
26
-
27
-
28
-
29
-
30
-
31
-
32
-
33
-
34
-
35
-
36
-
37
-
38
-
39
-
40
-
41
-
42
-
43
-
44
-
45
-
46
-
47
-
48
-
49
-
50
-
51
-
52
-
53
-
54
-
55
-
56
-
57
-
58
-
59
-
60
-
61
-
62
-
63
-
64
-
65
-
66
-
67
-
68
-
69
-
70
-
71
-
72
-
73
-
74
-
75
-
76
-
77
-
78
-
79
-
80
-
81
-
82
-
83
-
84
-
85
-
86
-
87
-
88
-
89
-
90
-
91
-
92
-
93
-
94
-
95
-
96
-
97
-
98
-
99
-
100
-
101
-
102
-
103
-
104
-
105
-
106
-
107
-
108
-
109
-
110
-
111
-
112
-
113
-
114
-
115
-
116
-
117
-
118
-
119
-
120
-
121
-
122
-
123
-
124
-
125
-
126
-
127
-
128
-
129
-
130
-
131
-
132
-
133
-
134
-
135
-
136
-
137
-
138
-
139
-
140
-
141
-
142
-
143
-
144
-
145
-
146
-
147
-
 148
148 -
 149
149 -
 150
150 -
 151
151 -
 152
152 -
 153
153 -
 154
154 -
 155
155 -
 156
156 -
 157
157 -
 158
158 -
 159
159 -
 160
160 -
 161
161 -
 162
162 -
 163
163 -
 164
164 -
 165
165 -
 166
166 -
 167
167 -
 168
168 -
169
-
170
-
171
-
172
-
173
-
174
-
175
-
176
-
177
-
178
-
179
-
180
-
181
-
182
-
183
-
184
-
185
-
186
-
187
-
188
-
189
-
190
-
191
-
192
-
193
-
194
-
195
-
196
-
197
-
198
-
199
-
200
-
201
-
202
-
203
-
204
-
205
-
206
-
207
-
208
 |
 |

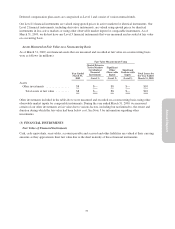
Cash, Cash Equivalents and Short-Term Investments
Cash, cash equivalents and short-term investments consisted of the following as of March 31, 2009 and 2008 (in
millions):
As of March 31, 2009 As of March 31, 2008
Cost or
Amortized
Cost
Gross
Unrealized Fair
Value
Cost or
Amortized
Cost
Gross
Unrealized Fair
ValueGains Losses Gains Losses
Cash and cash equivalents:
Cash .......................... $ 490 $— $— $ 490 $ 292 $— $— $ 292
Money market funds .............. 1,069 — — 1,069 1,251 — — 1,251
Commercial paper ............... 39 — — 39 7 — — 7
U.S. Treasury securities ........... 12 — — 12 — — — —
U.S. agency securities ............ 9 — — 9 3 — — 3
Corporate bonds ................. 2 — — 2 — — — —
Cash and cash equivalents ....... 1,621 — — 1,621 1,553 — — 1,553
Short-term investments:
U.S. Treasury securities ........... 198 2 — 200 159 2 — 161
Corporate bonds ................. 130 1 — 131 229 2 — 231
U.S. agency securities ............ 108 1 — 109 262 4 — 266
Commercial paper ............... 79 — — 79 12 — — 12
Asset-backed securities ........... 15 — — 15 63 1 — 64
Short-term investments .......... 530 4 — 534 725 9 — 734
Cash, cash equivalents and short-term
investments ..................... $2,151 $ 4 $— $2,155 $2,278 $ 9 $— $2,287
As of March 31, 2009 and 2008, we had less than $1 million in each year in gross unrealized losses primarily
attributable to our corporate bond investments. As of March 31, 2009 and 2008, these gross unrealized loss were
primarily in loss positions for less than 12 months.
We periodically evaluate our short-term investments for impairment in accordance with SFAS No. 115. Factors
considered in the review of investments with an unrealized loss include the credit quality of the issuer, the
duration and extent that the fair value has been less than the cost basis, severity of the impairment, reason for the
decline in value and potential recovery period, the financial condition and near-term prospects of the investees,
our intent and ability to hold the investments for a period of a time sufficient to allow for any anticipated
recovery in market value, as well as any contractual terms impacting the prepayment or settlement
process. Based on our review, we do not consider the investments listed above to be other-than-temporarily
impaired as of March 31, 2009.
Gross realized losses of $2 million and gross realized gains of $7 million were recognized from the sale of short-
term investments for the year ended March 31, 2009. Gross realized losses of $2 million and gross realized gains
of $9 million were recognized from the sale of short-term investments for the year ended March 31, 2008. Gross
realized losses of $1 million and gross realized gains of less than $1 million were recognized from the sale of
short-term investments for the year ended March 31, 2007.
78