Electronic Arts 2009 Annual Report Download - page 180
Download and view the complete annual report
Please find page 180 of the 2009 Electronic Arts annual report below. You can navigate through the pages in the report by either clicking on the pages listed below, or by using the keyword search tool below to find specific information within the annual report.-
 1
1 -
2
-
3
-
4
-
5
-
6
-
7
-
8
-
9
-
10
-
11
-
12
-
13
-
14
-
15
-
16
-
17
-
18
-
19
-
20
-
21
-
22
-
23
-
24
-
25
-
26
-
27
-
28
-
29
-
30
-
31
-
32
-
33
-
34
-
35
-
36
-
37
-
38
-
39
-
40
-
41
-
42
-
43
-
44
-
45
-
46
-
47
-
48
-
49
-
50
-
51
-
52
-
53
-
54
-
55
-
56
-
57
-
58
-
59
-
60
-
61
-
62
-
63
-
64
-
65
-
66
-
67
-
68
-
69
-
70
-
71
-
72
-
73
-
74
-
75
-
76
-
77
-
78
-
79
-
80
-
81
-
82
-
83
-
84
-
85
-
86
-
87
-
88
-
89
-
90
-
91
-
92
-
93
-
94
-
95
-
96
-
97
-
98
-
99
-
100
-
101
-
102
-
103
-
104
-
105
-
106
-
107
-
108
-
109
-
110
-
111
-
112
-
113
-
114
-
115
-
116
-
117
-
118
-
119
-
120
-
121
-
122
-
123
-
124
-
125
-
126
-
127
-
128
-
129
-
130
-
131
-
132
-
133
-
134
-
135
-
136
-
137
-
138
-
139
-
140
-
141
-
142
-
143
-
144
-
145
-
146
-
147
-
148
-
149
-
150
-
151
-
152
-
153
-
154
-
155
-
156
-
157
-
158
-
159
-
160
-
161
-
162
-
163
-
164
-
165
-
166
-
167
-
168
-
169
-
 170
170 -
 171
171 -
 172
172 -
 173
173 -
 174
174 -
 175
175 -
 176
176 -
 177
177 -
 178
178 -
 179
179 -
 180
180 -
 181
181 -
 182
182 -
 183
183 -
 184
184 -
 185
185 -
 186
186 -
 187
187 -
 188
188 -
 189
189 -
 190
190 -
191
-
192
-
193
-
194
-
195
-
196
-
197
-
198
-
199
-
200
-
201
-
202
-
203
-
204
-
205
-
206
-
207
-
208
 |
 |

•Expected volatility. We use a combination of historical stock price volatility and implied volatility
computed based on the price of options publicly traded on our common stock for our expected volatility
assumption.
•Expected term. The expected term represents the weighted-average period the stock options are
expected to remain outstanding. The expected term is determined based on historical exercise behavior,
post-vesting termination patterns, options outstanding and future expected exercise behavior.
•Expected dividends.
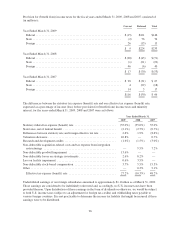
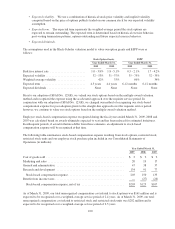
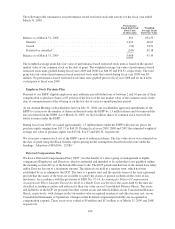
The assumptions used in the Black-Scholes valuation model to value our option grants and ESPP were as
follows:
Stock Option Grants ESPP
Year Ended March 31, Year Ended March 31,
2009 2008 2009 2008
Risk-free interest rate ........................ 1.0-3.8% 1.8 - 5.1% 0.5 - 2.1% 1.7 - 4.2%
Expected volatility ........................... 32-53% 31-37% 35-75% 32-35%
Weighted-average volatility ................... 42% 33% 66% 34%
Expected term .............................. 4.3years 4.4 years 6-12 months 6-12 months
Expected dividends .......................... None None None None
Prior to our adoption of SFAS No. 123(R), we valued our stock options based on the multiple-award valuation
method and recognized the expense using the accelerated approach over the requisite service period. In
conjunction with our adoption of SFAS No. 123(R), we changed our method of recognizing our stock-based
compensation expense for post-adoption grants to the straight-line approach over the requisite service period;
however, we continue to value our stock options based on the multiple-award valuation method.
Employee stock-based compensation expense recognized during the fiscal years ended March 31, 2009, 2008 and
2007 was calculated based on awards ultimately expected to vest and has been reduced for estimated forfeitures.
In subsequent periods, if actual forfeitures differ from those estimates, an adjustment to stock-based
compensation expense will be recognized at that time.
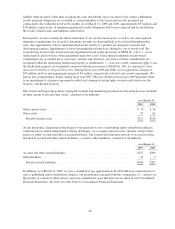
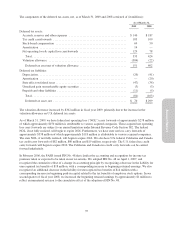
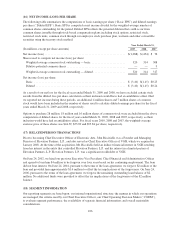
The following table summarizes stock-based compensation expense resulting from stock options, restricted stock,
restricted stock units and our employee stock purchase plan included in our Consolidated Statements of
Operations (in millions):
Year Ended March 31,
2009 2008 2007
Cost of goods sold ..................................................... $ 2 $ 2 $ 2
Marketing and sales .................................................... 20 19 17
General and administrative .............................................. 47 38 37
Research and development .............................................. 134 91 77
Stock-based compensation expense ...................................... 203 150 133
Benefit from income taxes ............................................... — (27) (26)
Stock-based compensation expense, net of tax ............................. $203 $123 $107
As of March 31, 2009, our total unrecognized compensation cost related to stock options was $161 million and is
expected to be recognized over a weighted-average service period of 2.4 years. As of March 31, 2009, our total
unrecognized compensation cost related to restricted stock and restricted stock units was $282 million and is
expected to be recognized over a weighted-average service period of 2.5 years.
100