Electronic Arts 2009 Annual Report Download - page 144
Download and view the complete annual report
Please find page 144 of the 2009 Electronic Arts annual report below. You can navigate through the pages in the report by either clicking on the pages listed below, or by using the keyword search tool below to find specific information within the annual report.-
 1
1 -
2
-
3
-
4
-
5
-
6
-
7
-
8
-
9
-
10
-
11
-
12
-
13
-
14
-
15
-
16
-
17
-
18
-
19
-
20
-
21
-
22
-
23
-
24
-
25
-
26
-
27
-
28
-
29
-
30
-
31
-
32
-
33
-
34
-
35
-
36
-
37
-
38
-
39
-
40
-
41
-
42
-
43
-
44
-
45
-
46
-
47
-
48
-
49
-
50
-
51
-
52
-
53
-
54
-
55
-
56
-
57
-
58
-
59
-
60
-
61
-
62
-
63
-
64
-
65
-
66
-
67
-
68
-
69
-
70
-
71
-
72
-
73
-
74
-
75
-
76
-
77
-
78
-
79
-
80
-
81
-
82
-
83
-
84
-
85
-
86
-
87
-
88
-
89
-
90
-
91
-
92
-
93
-
94
-
95
-
96
-
97
-
98
-
99
-
100
-
101
-
102
-
103
-
104
-
105
-
106
-
107
-
108
-
109
-
110
-
111
-
112
-
113
-
114
-
115
-
116
-
117
-
118
-
119
-
120
-
121
-
122
-
123
-
124
-
125
-
126
-
127
-
128
-
129
-
130
-
131
-
132
-
133
-
 134
134 -
 135
135 -
 136
136 -
 137
137 -
 138
138 -
 139
139 -
 140
140 -
 141
141 -
 142
142 -
 143
143 -
 144
144 -
 145
145 -
 146
146 -
 147
147 -
 148
148 -
 149
149 -
 150
150 -
 151
151 -
 152
152 -
 153
153 -
 154
154 -
155
-
156
-
157
-
158
-
159
-
160
-
161
-
162
-
163
-
164
-
165
-
166
-
167
-
168
-
169
-
170
-
171
-
172
-
173
-
174
-
175
-
176
-
177
-
178
-
179
-
180
-
181
-
182
-
183
-
184
-
185
-
186
-
187
-
188
-
189
-
190
-
191
-
192
-
193
-
194
-
195
-
196
-
197
-
198
-
199
-
200
-
201
-
202
-
203
-
204
-
205
-
206
-
207
-
208
 |
 |

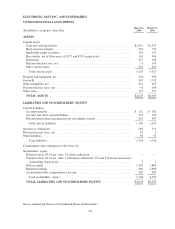
ELECTRONIC ARTS INC. AND SUBSIDIARIES
CONSOLIDATED BALANCE SHEETS
(In millions, except par value data) March 31,
2009
March 31,
2008
ASSETS
Current assets:
Cash and cash equivalents .................................................. $1,621 $1,553
Short-term investments .................................................... 534 734
Marketable equity securities ................................................ 365 729
Receivables, net of allowances of $217 and $238, respectively ..................... 116 306
Inventories .............................................................. 217 168
Deferred income taxes, net ................................................. 51 145
Other current assets ....................................................... 216 290
Total current assets ..................................................... 3,120 3,925
Property and equipment, net .................................................. 354 396
Goodwill ................................................................. 807 1,152
Other intangibles, net ....................................................... 221 265
Deferred income taxes, net ................................................... 61 164
Other assets ............................................................... 115 157
TOTAL ASSETS ........................................................ $4,678 $6,059
LIABILITIES AND STOCKHOLDERS’ EQUITY
Current liabilities:
Accounts payable ........................................................ $ 152 $ 182
Accrued and other current liabilities .......................................... 723 730
Deferred net revenue (packaged goods and digital content) ........................ 261 387
Total current liabilities .................................................. 1,136 1,299
Income tax obligations ...................................................... 268 319
Deferred income taxes, net ................................................... 42 5
Other liabilities ............................................................ 98 97
Total liabilities ........................................................ 1,544 1,720
Commitments and contingencies (See Note 10)
Stockholders’ equity:
Preferred stock, $0.01 par value. 10 shares authorized ............................ — —
Common stock, $0.01 par value. 1,000 shares authorized; 323 and 318 shares issued and
outstanding, respectively ................................................. 3 3
Paid-in capital ........................................................... 2,142 1,864
Retained earnings ........................................................ 800 1,888
Accumulated other comprehensive income .................................... 189 584
Total stockholders’ equity ................................................ 3,134 4,339
TOTAL LIABILITIES AND STOCKHOLDERS’ EQUITY .................... $4,678 $6,059
See accompanying Notes to Consolidated Financial Statements.
64