Electronic Arts 2009 Annual Report Download - page 188
Download and view the complete annual report
Please find page 188 of the 2009 Electronic Arts annual report below. You can navigate through the pages in the report by either clicking on the pages listed below, or by using the keyword search tool below to find specific information within the annual report.-
 1
1 -
2
-
3
-
4
-
5
-
6
-
7
-
8
-
9
-
10
-
11
-
12
-
13
-
14
-
15
-
16
-
17
-
18
-
19
-
20
-
21
-
22
-
23
-
24
-
25
-
26
-
27
-
28
-
29
-
30
-
31
-
32
-
33
-
34
-
35
-
36
-
37
-
38
-
39
-
40
-
41
-
42
-
43
-
44
-
45
-
46
-
47
-
48
-
49
-
50
-
51
-
52
-
53
-
54
-
55
-
56
-
57
-
58
-
59
-
60
-
61
-
62
-
63
-
64
-
65
-
66
-
67
-
68
-
69
-
70
-
71
-
72
-
73
-
74
-
75
-
76
-
77
-
78
-
79
-
80
-
81
-
82
-
83
-
84
-
85
-
86
-
87
-
88
-
89
-
90
-
91
-
92
-
93
-
94
-
95
-
96
-
97
-
98
-
99
-
100
-
101
-
102
-
103
-
104
-
105
-
106
-
107
-
108
-
109
-
110
-
111
-
112
-
113
-
114
-
115
-
116
-
117
-
118
-
119
-
120
-
121
-
122
-
123
-
124
-
125
-
126
-
127
-
128
-
129
-
130
-
131
-
132
-
133
-
134
-
135
-
136
-
137
-
138
-
139
-
140
-
141
-
142
-
143
-
144
-
145
-
146
-
147
-
148
-
149
-
150
-
151
-
152
-
153
-
154
-
155
-
156
-
157
-
158
-
159
-
160
-
161
-
162
-
163
-
164
-
165
-
166
-
167
-
168
-
169
-
170
-
171
-
172
-
173
-
174
-
175
-
176
-
177
-
 178
178 -
 179
179 -
 180
180 -
 181
181 -
 182
182 -
 183
183 -
 184
184 -
 185
185 -
 186
186 -
 187
187 -
 188
188 -
 189
189 -
 190
190 -
 191
191 -
 192
192 -
 193
193 -
 194
194 -
 195
195 -
 196
196 -
 197
197 -
 198
198 -
199
-
200
-
201
-
202
-
203
-
204
-
205
-
206
-
207
-
208
 |
 |

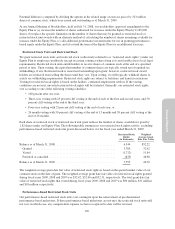
The following table summarizes the financial performance of our previous Publishing structure segments and a
reconciliation of our Publishing segment’s profit to our consolidated operating income for the fiscal year ended
March 31, 2007 (in millions):
Year Ended
March 31, 2007
Publishing segment:
Net revenue .................................................................. $2,948
Depreciation and amortization .................................................... (22)
Other expenses ................................................................ (1,685)
Publishing segment profit ......................................................... 1,241
Reconciliation to consolidated operating income:
Other:
Other net revenue .............................................................. 143
Depreciation and amortization .................................................... (145)
Other expenses ................................................................ (1,200)
Consolidated operating income ..................................................... $ 39
Publishing segment profit differs from consolidated operating income primarily due to the exclusion of
substantially all of our research and development expense, as well as certain corporate functional costs that are
not allocated to the publishing organizations.
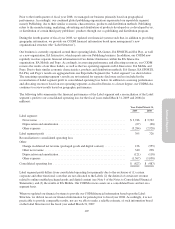
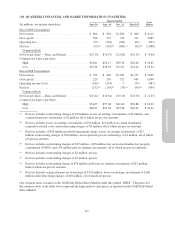
Information about our total net revenue by platform for the fiscal years ended March 31, 2009, 2008 and 2007 is
presented below (in millions):
Year Ended March 31,
2009 2008 2007
Consoles
Xbox 360 ....................................................... $1,005 $ 855 $ 499
PLAYSTATION 3 ................................................ 776 383 93
Wii ............................................................ 583 307 65
PlayStation 2 .................................................... 405 680 904
Xbox ........................................................... 1 20 160
Nintendo GameCube .............................................. — 6 61
Total Consoles ................................................. 2,770 2,251 1,782
PC............................................................... 712 702 679
Mobile Platforms
Nintendo DS ..................................................... 222 235 106
Wireless ........................................................ 189 152 142
PSP............................................................ 174 187 264
Game Boy Advance ............................................... — 8 40
Total Mobile .................................................. 585 582 552
Licensing and Other ................................................. 145 130 78
Total Net Revenue .................................................. $4,212 $3,665 $3,091
108