Electronic Arts 2009 Annual Report Download - page 189
Download and view the complete annual report
Please find page 189 of the 2009 Electronic Arts annual report below. You can navigate through the pages in the report by either clicking on the pages listed below, or by using the keyword search tool below to find specific information within the annual report.-
 1
1 -
2
-
3
-
4
-
5
-
6
-
7
-
8
-
9
-
10
-
11
-
12
-
13
-
14
-
15
-
16
-
17
-
18
-
19
-
20
-
21
-
22
-
23
-
24
-
25
-
26
-
27
-
28
-
29
-
30
-
31
-
32
-
33
-
34
-
35
-
36
-
37
-
38
-
39
-
40
-
41
-
42
-
43
-
44
-
45
-
46
-
47
-
48
-
49
-
50
-
51
-
52
-
53
-
54
-
55
-
56
-
57
-
58
-
59
-
60
-
61
-
62
-
63
-
64
-
65
-
66
-
67
-
68
-
69
-
70
-
71
-
72
-
73
-
74
-
75
-
76
-
77
-
78
-
79
-
80
-
81
-
82
-
83
-
84
-
85
-
86
-
87
-
88
-
89
-
90
-
91
-
92
-
93
-
94
-
95
-
96
-
97
-
98
-
99
-
100
-
101
-
102
-
103
-
104
-
105
-
106
-
107
-
108
-
109
-
110
-
111
-
112
-
113
-
114
-
115
-
116
-
117
-
118
-
119
-
120
-
121
-
122
-
123
-
124
-
125
-
126
-
127
-
128
-
129
-
130
-
131
-
132
-
133
-
134
-
135
-
136
-
137
-
138
-
139
-
140
-
141
-
142
-
143
-
144
-
145
-
146
-
147
-
148
-
149
-
150
-
151
-
152
-
153
-
154
-
155
-
156
-
157
-
158
-
159
-
160
-
161
-
162
-
163
-
164
-
165
-
166
-
167
-
168
-
169
-
170
-
171
-
172
-
173
-
174
-
175
-
176
-
177
-
178
-
 179
179 -
 180
180 -
 181
181 -
 182
182 -
 183
183 -
 184
184 -
 185
185 -
 186
186 -
 187
187 -
 188
188 -
 189
189 -
 190
190 -
 191
191 -
 192
192 -
 193
193 -
 194
194 -
 195
195 -
 196
196 -
 197
197 -
 198
198 -
 199
199 -
200
-
201
-
202
-
203
-
204
-
205
-
206
-
207
-
208
 |
 |

Annual Report
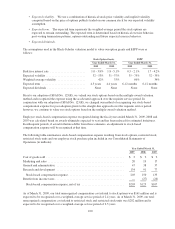
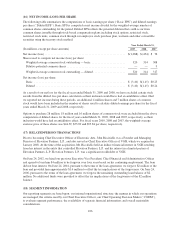
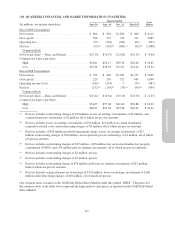
Information about our operations in North America, Europe and Asia as of and for the fiscal years ended
March 31, 2009, 2008 and 2007 is presented below (in millions):
North
America Europe Asia Total
Year ended March 31, 2009
Net revenue from unaffiliated customers ......................... $2,412 $1,589 $211 $4,212
Long-lived assets ........................................... 1,171 169 42 1,382
Year ended March 31, 2008
Net revenue from unaffiliated customers ......................... $1,942 $1,541 $182 $3,665
Long-lived assets ........................................... 1,630 173 10 1,813
Year ended March 31, 2007
Net revenue from unaffiliated customers ......................... $1,666 $1,261 $164 $3,091
Long-lived assets ........................................... 1,150 267 11 1,428
Substantially all of our North America net revenue is generated in the United States.
Our direct sales to GameStop Corp. represented approximately 14 percent, 13 percent and 12 percent of total net
revenue in fiscal years ended March 31, 2009, 2008, and 2007 respectively. Our direct sales to Wal-Mart Stores,
Inc. represented approximately 14 percent, 12 percent and 13 percent of total net revenue in fiscal years ended
March 31, 2009, 2008 and 2007, respectively.
(19) STAFF ACCOUNTING BULLETIN No. 108
In September 2006, the SEC issued SAB No. 108, Financial Statements — Considering the Effects of Prior Year
Misstatements when Quantifying Misstatements in Current Year Financial Statements. SAB No. 108 provides
guidance on how prior year misstatements should be taken into consideration when quantifying misstatements in
current year financial statements for purposes of determining whether the current year’s financial statements are
materially misstated. We adopted SAB No. 108 in fiscal year 2007.
In accordance with SAB No. 108, we considered both the “rollover” approach, which quantifies misstatements
originating in the current year income statement and the “iron curtain” approach, which quantifies misstatements
based on the effects of correcting the misstatements existing in the balance sheet at the end of the reporting
period. Prior to our application of the guidance in SAB No. 108, we used the rollover approach. We elected to
recognize the cumulative effect of adoption as adjustments to assets and liabilities as of the beginning of fiscal
year 2007 and the offsetting adjustment to the opening balance of retained earnings for fiscal year 2007.
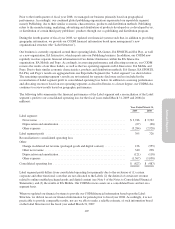
Property and Equipment Capitalization Adjustment
We adjusted the beginning retained earnings balance for fiscal year 2007 related to the correction of our
historical accounting treatment of certain property and equipment purchases. We capitalize property and
equipment purchases when certain quantitative thresholds are met; otherwise, they are expensed when purchased.
Our internal review of our capitalization thresholds suggested that certain property and equipment should have
been capitalized and not expensed. We believe the impact of the property and equipment capitalization errors
were not material to prior years’ income statements under the rollover approach. However, under the iron curtain
method, the cumulative property and equipment capitalization errors were material to our fiscal year 2007
Consolidated Financial Statements and, therefore, we recognized the following cumulative adjustment to our
fiscal year 2007 opening Consolidated Balance Sheets (in millions):
Increase in property and equipment, net ...................................................... $13
Increase in deferred income tax liabilities .................................................... 3
Increase in retained earnings ............................................................... 10
109