Electronic Arts 2009 Annual Report Download - page 124
Download and view the complete annual report
Please find page 124 of the 2009 Electronic Arts annual report below. You can navigate through the pages in the report by either clicking on the pages listed below, or by using the keyword search tool below to find specific information within the annual report.-
 1
1 -
2
-
3
-
4
-
5
-
6
-
7
-
8
-
9
-
10
-
11
-
12
-
13
-
14
-
15
-
16
-
17
-
18
-
19
-
20
-
21
-
22
-
23
-
24
-
25
-
26
-
27
-
28
-
29
-
30
-
31
-
32
-
33
-
34
-
35
-
36
-
37
-
38
-
39
-
40
-
41
-
42
-
43
-
44
-
45
-
46
-
47
-
48
-
49
-
50
-
51
-
52
-
53
-
54
-
55
-
56
-
57
-
58
-
59
-
60
-
61
-
62
-
63
-
64
-
65
-
66
-
67
-
68
-
69
-
70
-
71
-
72
-
73
-
74
-
75
-
76
-
77
-
78
-
79
-
80
-
81
-
82
-
83
-
84
-
85
-
86
-
87
-
88
-
89
-
90
-
91
-
92
-
93
-
94
-
95
-
96
-
97
-
98
-
99
-
100
-
101
-
102
-
103
-
104
-
105
-
106
-
107
-
108
-
109
-
110
-
111
-
112
-
113
-
 114
114 -
 115
115 -
 116
116 -
 117
117 -
 118
118 -
 119
119 -
 120
120 -
 121
121 -
 122
122 -
 123
123 -
 124
124 -
 125
125 -
 126
126 -
 127
127 -
 128
128 -
 129
129 -
 130
130 -
 131
131 -
 132
132 -
 133
133 -
 134
134 -
135
-
136
-
137
-
138
-
139
-
140
-
141
-
142
-
143
-
144
-
145
-
146
-
147
-
148
-
149
-
150
-
151
-
152
-
153
-
154
-
155
-
156
-
157
-
158
-
159
-
160
-
161
-
162
-
163
-
164
-
165
-
166
-
167
-
168
-
169
-
170
-
171
-
172
-
173
-
174
-
175
-
176
-
177
-
178
-
179
-
180
-
181
-
182
-
183
-
184
-
185
-
186
-
187
-
188
-
189
-
190
-
191
-
192
-
193
-
194
-
195
-
196
-
197
-
198
-
199
-
200
-
201
-
202
-
203
-
204
-
205
-
206
-
207
-
208
 |
 |

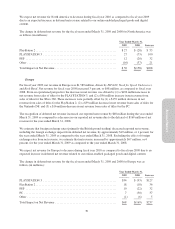
During the fiscal year 2008, we incurred approximately $97 million of reorganization charges, of which $58
million was for facilities-related expenses, $27 million was other expenses including contracted services costs to
assist in the reorganization of our business support functions, and $12 million was employee-related expenses.
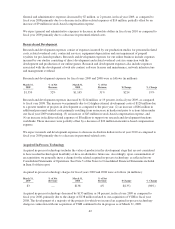
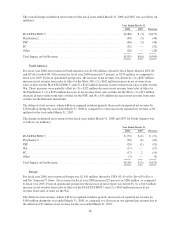
Losses on Strategic Investments, Net
Losses on strategic investments, net for fiscal years 2009 and 2008 were as follows (in millions):
March 31,
2009
% of Net
Revenue
March 31,
2008
% of Net
Revenue $ Change % Change
$(62) (1%) $(118) (3%) $56 (47%)
During the fiscal year ended March 31, 2009, losses on strategic investments, net decreased by $56 million, or 47
percent, as compared to the year ended March 31, 2008. We recognized (1) a $40 million impairment charge on
our investments in Neowiz’s common and preferred shares and (2) a $27 million impairment charge on our
investment in The9 during the fiscal year ended March 31, 2009. These charges were offset by a $5 million
dividend received from our investment in The9.
During the fiscal year ended March 31, 2008, we recognized (1) an $81 million impairment charge on our
investment in The9 and (2) a $37 million impairment charge on our investments in Neowiz Corporation’s
common and preferred shares.
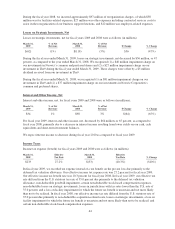
Interest and Other Income, Net
Interest and other income, net, for fiscal years 2009 and 2008 were as follows (in millions):
March 31,
2009
% of Net
Revenue
March 31,
2008
% of Net
Revenue $ Change % Change
$34 1% $98 3% $(64) (65%)
For fiscal year 2009, interest and other income, net, decreased by $64 million, or 65 percent, as compared to
fiscal year 2008, primarily due to a decrease in interest income resulting from lower yields on our cash, cash
equivalents and short-term investment balances.
We expect interest income to decrease during fiscal year 2010 as compared to fiscal year 2009.
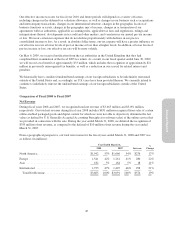
Income Taxes
Income tax expense (benefit) for fiscal years 2009 and 2008 were as follows (in millions):
March 31,
2009
Effective
Tax Rate
March 31,
2008
Effective
Tax Rate % Change
$233 27.2% $(53) (10.3%) (540%)
In fiscal year 2009, we recorded tax expense instead of a tax benefit on the pre-tax loss due primarily to the
deferred tax valuation allowance. Our effective income tax expense rate was 27.2 percent for fiscal year 2009.
Our effective income tax benefit rate was 10.3 percent for fiscal year 2008. In fiscal year 2009, our effective tax
rate differed from the U.S. statutory tax rate of 35.0 percent due primarily to the deferred tax valuation
allowance, non-deductible goodwill impairment, certain non-deductible stock-based compensation expenses,
non-deductible losses on strategic investments, losses in jurisdictions with tax rates lower than the U.S. rate of
35.0 percent, and a loss on facility impairment for which the future tax benefit is uncertain and not more likely
than not to be realized. In fiscal year 2008, our effective income tax rate differed from the U.S. statutory rate of
35.0 percent due primarily to non-deductible acquisition-related costs, losses on strategic investments, a loss on
facility impairment for which the future tax benefit is uncertain and not more likely than not to be realized, and
certain non-deductible stock-based compensation expenses.
44