Electronic Arts 2009 Annual Report Download - page 128
Download and view the complete annual report
Please find page 128 of the 2009 Electronic Arts annual report below. You can navigate through the pages in the report by either clicking on the pages listed below, or by using the keyword search tool below to find specific information within the annual report.-
 1
1 -
2
-
3
-
4
-
5
-
6
-
7
-
8
-
9
-
10
-
11
-
12
-
13
-
14
-
15
-
16
-
17
-
18
-
19
-
20
-
21
-
22
-
23
-
24
-
25
-
26
-
27
-
28
-
29
-
30
-
31
-
32
-
33
-
34
-
35
-
36
-
37
-
38
-
39
-
40
-
41
-
42
-
43
-
44
-
45
-
46
-
47
-
48
-
49
-
50
-
51
-
52
-
53
-
54
-
55
-
56
-
57
-
58
-
59
-
60
-
61
-
62
-
63
-
64
-
65
-
66
-
67
-
68
-
69
-
70
-
71
-
72
-
73
-
74
-
75
-
76
-
77
-
78
-
79
-
80
-
81
-
82
-
83
-
84
-
85
-
86
-
87
-
88
-
89
-
90
-
91
-
92
-
93
-
94
-
95
-
96
-
97
-
98
-
99
-
100
-
101
-
102
-
103
-
104
-
105
-
106
-
107
-
108
-
109
-
110
-
111
-
112
-
113
-
114
-
115
-
116
-
117
-
 118
118 -
 119
119 -
 120
120 -
 121
121 -
 122
122 -
 123
123 -
 124
124 -
 125
125 -
 126
126 -
 127
127 -
 128
128 -
 129
129 -
 130
130 -
 131
131 -
 132
132 -
 133
133 -
 134
134 -
 135
135 -
 136
136 -
 137
137 -
 138
138 -
139
-
140
-
141
-
142
-
143
-
144
-
145
-
146
-
147
-
148
-
149
-
150
-
151
-
152
-
153
-
154
-
155
-
156
-
157
-
158
-
159
-
160
-
161
-
162
-
163
-
164
-
165
-
166
-
167
-
168
-
169
-
170
-
171
-
172
-
173
-
174
-
175
-
176
-
177
-
178
-
179
-
180
-
181
-
182
-
183
-
184
-
185
-
186
-
187
-
188
-
189
-
190
-
191
-
192
-
193
-
194
-
195
-
196
-
197
-
198
-
199
-
200
-
201
-
202
-
203
-
204
-
205
-
206
-
207
-
208
 |
 |

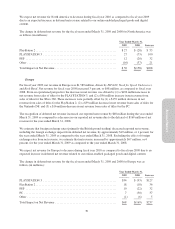
For fiscal year 2008, cost of goods sold increased by 10.1 percent as a percentage of total net revenue as
compared to fiscal year 2007. This increase was primarily due to (1) higher co-publishing and distribution
royalty costs of approximately 8 percent as a percentage of total net revenue primarily driven by sales of Rock
Band, and, to a lesser extent, other co-publishing and distribution titles that have a lower gross margin and (2) the
increase in net revenue deferrals of $355 million related to certain online-enabled packaged goods and digital
content. Overall, we estimate the deferral of net revenue negatively impacted cost of goods sold as a percent of
total net revenue by 4 percent.
As a percentage of total net revenue, the overall increase in cost of goods sold was partially offset by lower
license royalty rates of approximately 1 percent as a percentage of total net revenue primarily due to a higher
proportion of sales in fiscal year 2008 from our owned intellectual property franchises that have lower royalty
rates as compared to fiscal year 2007.
Marketing and Sales
Marketing and sales expenses for fiscal years 2008 and 2007 were as follows (in millions):
March 31,
2008
% of Net
Revenue
March 31,
2007
% of Net
Revenue $ Change % Change
$588 16% $466 15% $122 26%
As a percentage of net revenue, marketing and sales expenses were adversely impacted by our deferral of net
revenue related to online-enabled packaged goods and digital content during fiscal year 2008.
Marketing and sales expenses increased by $122 million, or 26 percent, in fiscal 2008 as compared to fiscal year
2007. The increase was primarily due to (1) an increase of $90 million in marketing, advertising and promotional
expenses primarily to support our launch of new franchises and incremental spending on established franchises,
as well as (2) a $23 million increase in personnel-related costs primarily resulting from an increase in headcount.
Marketing and sales expenses included vendor reimbursements for advertising expenses of $54 million and $28
million in fiscal years 2008 and 2007, respectively.
General and Administrative
General and administrative expenses for fiscal years 2008 and 2007 were as follows (in millions):
March 31,
2008
% of Net
Revenue
March 31,
2007
% of Net
Revenue $ Change % Change
$339 9% $288 9% $51 18%
As a percentage of net revenue, general and administrative expenses were adversely impacted by our deferral of
net revenue related to online-enabled packaged goods and digital content during fiscal year 2008.
General and administrative expenses increased by $51 million, or 18 percent, in fiscal year 2008 as compared to
fiscal year 2007 primarily due to (1) an increase of $23 million in additional personnel-related costs to help
support our administrative functions worldwide, (2) an increase in contracted services associated with IT systems
initiatives, professional services and business development of $21 million to support the growth of the
organization, and (3) an increase in facilities-related expenses of $12 million in support of our administrative
functions worldwide. These increases were partially offset by a $7 million reduction in incentive-based
compensation expense.
48