Electronic Arts 2009 Annual Report Download - page 182
Download and view the complete annual report
Please find page 182 of the 2009 Electronic Arts annual report below. You can navigate through the pages in the report by either clicking on the pages listed below, or by using the keyword search tool below to find specific information within the annual report.-
 1
1 -
2
-
3
-
4
-
5
-
6
-
7
-
8
-
9
-
10
-
11
-
12
-
13
-
14
-
15
-
16
-
17
-
18
-
19
-
20
-
21
-
22
-
23
-
24
-
25
-
26
-
27
-
28
-
29
-
30
-
31
-
32
-
33
-
34
-
35
-
36
-
37
-
38
-
39
-
40
-
41
-
42
-
43
-
44
-
45
-
46
-
47
-
48
-
49
-
50
-
51
-
52
-
53
-
54
-
55
-
56
-
57
-
58
-
59
-
60
-
61
-
62
-
63
-
64
-
65
-
66
-
67
-
68
-
69
-
70
-
71
-
72
-
73
-
74
-
75
-
76
-
77
-
78
-
79
-
80
-
81
-
82
-
83
-
84
-
85
-
86
-
87
-
88
-
89
-
90
-
91
-
92
-
93
-
94
-
95
-
96
-
97
-
98
-
99
-
100
-
101
-
102
-
103
-
104
-
105
-
106
-
107
-
108
-
109
-
110
-
111
-
112
-
113
-
114
-
115
-
116
-
117
-
118
-
119
-
120
-
121
-
122
-
123
-
124
-
125
-
126
-
127
-
128
-
129
-
130
-
131
-
132
-
133
-
134
-
135
-
136
-
137
-
138
-
139
-
140
-
141
-
142
-
143
-
144
-
145
-
146
-
147
-
148
-
149
-
150
-
151
-
152
-
153
-
154
-
155
-
156
-
157
-
158
-
159
-
160
-
161
-
162
-
163
-
164
-
165
-
166
-
167
-
168
-
169
-
170
-
171
-
 172
172 -
 173
173 -
 174
174 -
 175
175 -
 176
176 -
 177
177 -
 178
178 -
 179
179 -
 180
180 -
 181
181 -
 182
182 -
 183
183 -
 184
184 -
 185
185 -
 186
186 -
 187
187 -
 188
188 -
 189
189 -
 190
190 -
 191
191 -
 192
192 -
193
-
194
-
195
-
196
-
197
-
198
-
199
-
200
-
201
-
202
-
203
-
204
-
205
-
206
-
207
-
208
 |
 |

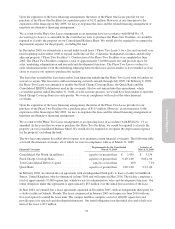
Options granted under the Equity Plan generally expire ten years from the date of grant and are generally
exercisable as to 24 percent of the shares after 12 months, and then ratably over the following 38 months. The
material terms of options granted under the JAMDAT and VGH 2005 Plans are similar to our Equity Incentive
Plan.
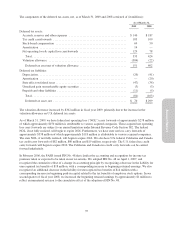
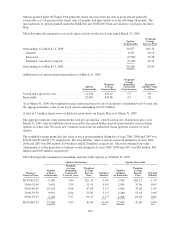
The following table summarizes our stock option activity for the fiscal year ended March 31, 2009:
Options
(in thousands)
Weighted-
Average
Exercise Price
Outstanding as of March 31, 2008 ...................................... 36,077 $43.32
Granted ......................................................... 6,291 29.76
Exercised ........................................................ (2,598) 22.38
Forfeited, cancelled or expired ....................................... (5,410) 45.76
Outstanding as of March 31, 2009 ...................................... 34,360 42.04
Additional stock option-related information as of March 31, 2009:
Options
(in thousands)
Weighted-
Average
Exercise Price
Weighted-
Average
Remaining
Contractual
Term (in years)
Aggregate
Intrinsic Value
(in millions)
Vested and expected to vest ............... 31,246 $42.07 5.7 $9
Exercisable ............................ 22,003 $43.06 4.5 $2
As of March 31, 2009, the weighted-average contractual term for our stock options outstanding was 6.0 years and
the aggregate intrinsic value of our stock options outstanding was $11 million.
A total of 11 million shares were available for grant under our Equity Plan as of March 31, 2009.
The aggregate intrinsic value represents the total pre-tax intrinsic value based on our closing stock price as of
March 31, 2009, which would have been received by the option holders had all option holders exercised their
options as of that date. We issue new common stock from our authorized shares upon the exercise of stock
options.
The weighted-average grant-date fair value of stock options granted during fiscal years 2009, 2008 and 2007 was
$10.28, $16.85 and $17.75, respectively. The total intrinsic value of options exercised during fiscal years 2009,
2008 and 2007 was $46 million, $144 million and $120 million, respectively. The total estimated fair value
(determined as of the grant date) of options vested during fiscal years 2009, 2008 and 2007 was $83 million, $82
million and $105 million, respectively.
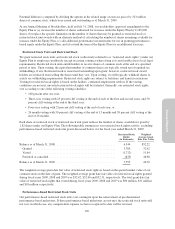
The following table summarizes outstanding and exercisable options as of March 31, 2009:
Options Outstanding Options Exercisable
Range of
Exercise Prices
Number
of Shares
(in thousands)
Weighted-
Average
Remaining
Contractual
Term (in years)
Weighted-
Average
Exercise
Price
Potential
Dilution
Number
of Shares
(in thousands)
Weighted-
Average
Exercise
Price
Potential
Dilution
$0.65-$29.99 9,168 5.04 $21.35 2.8% 5,418 $24.25 1.7%
30.00-39.99 3,005 3.35 31.91 0.9% 2,995 31.90 0.9%
40.00-49.99 10,128 6.98 47.84 3.1% 5,062 47.60 1.6%
50.00-59.99 9,919 6.64 53.50 3.1% 6,480 53.63 2.0%
60.00-65.93 2,140 5.37 64.35 0.7% 2,048 64.48 0.6%
$0.65-$65.93 34,360 5.95 42.04 10.6% 22,003 43.06 6.8%
102