Electronic Arts 2009 Annual Report Download - page 121
Download and view the complete annual report
Please find page 121 of the 2009 Electronic Arts annual report below. You can navigate through the pages in the report by either clicking on the pages listed below, or by using the keyword search tool below to find specific information within the annual report.-
 1
1 -
2
-
3
-
4
-
5
-
6
-
7
-
8
-
9
-
10
-
11
-
12
-
13
-
14
-
15
-
16
-
17
-
18
-
19
-
20
-
21
-
22
-
23
-
24
-
25
-
26
-
27
-
28
-
29
-
30
-
31
-
32
-
33
-
34
-
35
-
36
-
37
-
38
-
39
-
40
-
41
-
42
-
43
-
44
-
45
-
46
-
47
-
48
-
49
-
50
-
51
-
52
-
53
-
54
-
55
-
56
-
57
-
58
-
59
-
60
-
61
-
62
-
63
-
64
-
65
-
66
-
67
-
68
-
69
-
70
-
71
-
72
-
73
-
74
-
75
-
76
-
77
-
78
-
79
-
80
-
81
-
82
-
83
-
84
-
85
-
86
-
87
-
88
-
89
-
90
-
91
-
92
-
93
-
94
-
95
-
96
-
97
-
98
-
99
-
100
-
101
-
102
-
103
-
104
-
105
-
106
-
107
-
108
-
109
-
110
-
 111
111 -
 112
112 -
 113
113 -
 114
114 -
 115
115 -
 116
116 -
 117
117 -
 118
118 -
 119
119 -
 120
120 -
 121
121 -
 122
122 -
 123
123 -
 124
124 -
 125
125 -
 126
126 -
 127
127 -
 128
128 -
 129
129 -
 130
130 -
 131
131 -
132
-
133
-
134
-
135
-
136
-
137
-
138
-
139
-
140
-
141
-
142
-
143
-
144
-
145
-
146
-
147
-
148
-
149
-
150
-
151
-
152
-
153
-
154
-
155
-
156
-
157
-
158
-
159
-
160
-
161
-
162
-
163
-
164
-
165
-
166
-
167
-
168
-
169
-
170
-
171
-
172
-
173
-
174
-
175
-
176
-
177
-
178
-
179
-
180
-
181
-
182
-
183
-
184
-
185
-
186
-
187
-
188
-
189
-
190
-
191
-
192
-
193
-
194
-
195
-
196
-
197
-
198
-
199
-
200
-
201
-
202
-
203
-
204
-
205
-
206
-
207
-
208
 |
 |

Annual Report
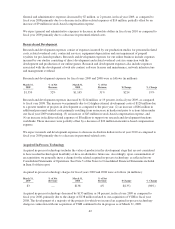
For fiscal year 2009, cost of goods sold increased by 1.2 percent as a percentage of total net revenue as compared
to fiscal year 2008. This increase was primarily due to:
• A greater percentage of net revenue from co-publishing and distribution products, which have a lower
margin, as compared to our EA studio products,
• An increase in price protection taken or expected to be taken for products already sold,
• An increase in our inventory write-downs as a result of future expected demand for our products, and
• Losses on intellectual property licensor agreements.
The overall increase in cost of goods sold as a percentage of net revenue was mitigated by a $481 million
favorable change in deferred net revenue related to certain online-enabled packaged goods and digital content
during the twelve months ended March 31, 2009 as compared to the twelve months ended March 31, 2008, which
positively impacted cost of goods sold as a percent of total net revenue by approximately 6 percent.
Although there can be no assurance, and our actual results could differ materially, in the short term we expect our
gross margin as a percentage of total net revenue to increase in fiscal year 2010 as compared to fiscal year 2009
due to anticipated margin improvements, partially off-set by an expected increase in deferred net revenue related
to our online-enabled packaged goods and digital content. We expense the cost of goods sold related to these
transactions during the period in which the product is delivered (rather than on a deferred basis).
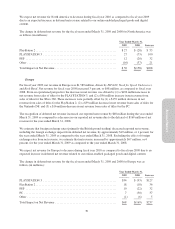
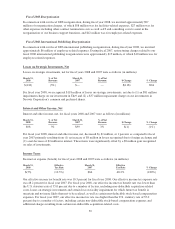
Marketing and Sales
Marketing and sales expenses consist of personnel-related costs, related overhead costs and advertising,
marketing and promotional expenses, net of qualified advertising cost reimbursements from third parties.
Marketing and sales expenses for fiscal years 2009 and 2008 were as follows (in millions):
March 31,
2009
% of Net
Revenue
March 31,
2008
% of Net
Revenue $ Change % Change
$691 16% $588 16% $103 18%
Marketing and sales expenses increased by $103 million, or 18 percent, in fiscal year 2009, as compared to fiscal
year 2008. The increase was primarily due to (1) an increase of $85 million in marketing, advertising and
promotional expenses primarily to support our launch of new franchises and incremental spending on established
franchises and (2) a $17 million increase in additional personnel-related costs primarily resulting from an
increase in headcount prior to actions taken under our fiscal 2009 restructuring.
Marketing and sales expenses included vendor reimbursements for advertising expenses of $31 million and $54
million in fiscal years 2009 and 2008, respectively.
We expect marketing and sales expenses to decrease in absolute dollars in fiscal year 2010 as compared to fiscal
year 2009 primarily due to lower advertising and marketing activity to support our titles and a decrease in
personnel-related costs.
General and Administrative
General and administrative expenses consist of personnel and related expenses of executive and administrative
staff, related overhead costs, fees for professional services such as legal and accounting, and allowances for
doubtful accounts.
General and administrative expenses for fiscal years 2009 and 2008 were as follows (in millions):
March 31,
2009
% of Net
Revenue
March 31,
2008
% of Net
Revenue $ Change % Change
$332 8% $339 9% $(7) (2%)
41