Electronic Arts 2009 Annual Report Download - page 187
Download and view the complete annual report
Please find page 187 of the 2009 Electronic Arts annual report below. You can navigate through the pages in the report by either clicking on the pages listed below, or by using the keyword search tool below to find specific information within the annual report.-
 1
1 -
2
-
3
-
4
-
5
-
6
-
7
-
8
-
9
-
10
-
11
-
12
-
13
-
14
-
15
-
16
-
17
-
18
-
19
-
20
-
21
-
22
-
23
-
24
-
25
-
26
-
27
-
28
-
29
-
30
-
31
-
32
-
33
-
34
-
35
-
36
-
37
-
38
-
39
-
40
-
41
-
42
-
43
-
44
-
45
-
46
-
47
-
48
-
49
-
50
-
51
-
52
-
53
-
54
-
55
-
56
-
57
-
58
-
59
-
60
-
61
-
62
-
63
-
64
-
65
-
66
-
67
-
68
-
69
-
70
-
71
-
72
-
73
-
74
-
75
-
76
-
77
-
78
-
79
-
80
-
81
-
82
-
83
-
84
-
85
-
86
-
87
-
88
-
89
-
90
-
91
-
92
-
93
-
94
-
95
-
96
-
97
-
98
-
99
-
100
-
101
-
102
-
103
-
104
-
105
-
106
-
107
-
108
-
109
-
110
-
111
-
112
-
113
-
114
-
115
-
116
-
117
-
118
-
119
-
120
-
121
-
122
-
123
-
124
-
125
-
126
-
127
-
128
-
129
-
130
-
131
-
132
-
133
-
134
-
135
-
136
-
137
-
138
-
139
-
140
-
141
-
142
-
143
-
144
-
145
-
146
-
147
-
148
-
149
-
150
-
151
-
152
-
153
-
154
-
155
-
156
-
157
-
158
-
159
-
160
-
161
-
162
-
163
-
164
-
165
-
166
-
167
-
168
-
169
-
170
-
171
-
172
-
173
-
174
-
175
-
176
-
 177
177 -
 178
178 -
 179
179 -
 180
180 -
 181
181 -
 182
182 -
 183
183 -
 184
184 -
 185
185 -
 186
186 -
 187
187 -
 188
188 -
 189
189 -
 190
190 -
 191
191 -
 192
192 -
 193
193 -
 194
194 -
 195
195 -
 196
196 -
 197
197 -
198
-
199
-
200
-
201
-
202
-
203
-
204
-
205
-
206
-
207
-
208
 |
 |

Annual Report
Prior to the fourth quarter of fiscal year 2008, we managed our business primarily based on geographical
performance. Accordingly, our combined global publishing organizations represented our reportable segment,
namely Publishing, due to their similar economic characteristics, products and distribution methods. Publishing
refers to the manufacturing, marketing, advertising and distribution of products developed or co-developed by us,
or distribution of certain third-party publishers’ products through our co-publishing and distribution program.
During the fourth quarter of fiscal year 2008, we updated our financial systems such that, in addition to providing
geographic information, we provide our CODM financial information based upon management’s new
organizational structure (the “Label Structure”).
Our business is currently organized around three operating labels, EA Games, EA SPORTS and EA Play, as well
as a new organization, EA Interactive, which reports into our Publishing business. In addition, our CODM now
regularly receives separate financial information for two distinct businesses within the EA Interactive
organization: EA Mobile and Pogo. Accordingly, in assessing performance and allocating resources, our CODM
reviews the results of our three Labels, as well as the two operating segments in EA Interactive: EA Mobile and
Pogo. Due to their similar economic characteristics, products and distribution methods, EA Games, EA SPORTS,
EA Play and Pogo’s results are aggregated into one Reportable Segment (the “Label segment”) as shown below.
The remaining operating segment’s results are not material for separate disclosure and are included in the
reconciliation of Label segment profit to consolidated operating loss below. In addition to assessing performance
and allocating resources based on our operating segments as described herein, to a lesser degree, our CODM also
continues to review results based on geographic performance.
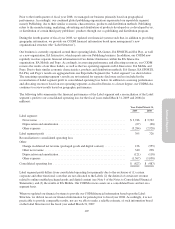
The following table summarizes the financial performance of the Label segment and a reconciliation of the Label
segment’s profit to our consolidated operating loss for the fiscal years ended March 31, 2009 and 2008 (in
millions):
Year Ended March 31,
2009 2008
Label segment:
Net revenue ........................................................... $3,746 $ 3,722
Depreciation and amortization ............................................. (67) (68)
Other expenses ......................................................... (3,284) (2,928)
Label segment profit ...................................................... 395 726
Reconciliation to consolidated operating loss:
Other:
Change in deferred net revenue (packaged goods and digital content) .............. 126 (355)
Other net revenue ....................................................... 340 298
Depreciation and amortization ............................................. (121) (118)
Other expenses ......................................................... (1,567) (1,038)
Consolidated operating loss ................................................. $ (827) $ (487)
Label segment profit differs from consolidated operating loss primarily due to the exclusion of (1) certain
corporate and other functional costs that are not allocated to the Labels (2) the deferral of certain net revenue
related to online-enabled packaged goods and digital content (see Note 9 of the Notes to Consolidated Financial
Statements), and (3) the results of EA Mobile. Our CODM reviews assets on a consolidated basis and not on a
segment basis.
When we updated our financial systems to provide our CODM financial information based upon the Label
Structure, we did not recast our financial information for periods prior to fiscal year 2008. Accordingly, it is not
practicable to provide comparable results, nor are we able to make a reliable estimate, of such information based
on the Label Structure for the fiscal year ended March 31, 2007.
107