Electronic Arts 2009 Annual Report Download - page 171
Download and view the complete annual report
Please find page 171 of the 2009 Electronic Arts annual report below. You can navigate through the pages in the report by either clicking on the pages listed below, or by using the keyword search tool below to find specific information within the annual report.-
 1
1 -
2
-
3
-
4
-
5
-
6
-
7
-
8
-
9
-
10
-
11
-
12
-
13
-
14
-
15
-
16
-
17
-
18
-
19
-
20
-
21
-
22
-
23
-
24
-
25
-
26
-
27
-
28
-
29
-
30
-
31
-
32
-
33
-
34
-
35
-
36
-
37
-
38
-
39
-
40
-
41
-
42
-
43
-
44
-
45
-
46
-
47
-
48
-
49
-
50
-
51
-
52
-
53
-
54
-
55
-
56
-
57
-
58
-
59
-
60
-
61
-
62
-
63
-
64
-
65
-
66
-
67
-
68
-
69
-
70
-
71
-
72
-
73
-
74
-
75
-
76
-
77
-
78
-
79
-
80
-
81
-
82
-
83
-
84
-
85
-
86
-
87
-
88
-
89
-
90
-
91
-
92
-
93
-
94
-
95
-
96
-
97
-
98
-
99
-
100
-
101
-
102
-
103
-
104
-
105
-
106
-
107
-
108
-
109
-
110
-
111
-
112
-
113
-
114
-
115
-
116
-
117
-
118
-
119
-
120
-
121
-
122
-
123
-
124
-
125
-
126
-
127
-
128
-
129
-
130
-
131
-
132
-
133
-
134
-
135
-
136
-
137
-
138
-
139
-
140
-
141
-
142
-
143
-
144
-
145
-
146
-
147
-
148
-
149
-
150
-
151
-
152
-
153
-
154
-
155
-
156
-
157
-
158
-
159
-
160
-
 161
161 -
 162
162 -
 163
163 -
 164
164 -
 165
165 -
 166
166 -
 167
167 -
 168
168 -
 169
169 -
 170
170 -
 171
171 -
 172
172 -
 173
173 -
 174
174 -
 175
175 -
 176
176 -
 177
177 -
 178
178 -
 179
179 -
 180
180 -
 181
181 -
182
-
183
-
184
-
185
-
186
-
187
-
188
-
189
-
190
-
191
-
192
-
193
-
194
-
195
-
196
-
197
-
198
-
199
-
200
-
201
-
202
-
203
-
204
-
205
-
206
-
207
-
208
 |
 |

Annual Report
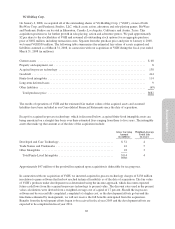
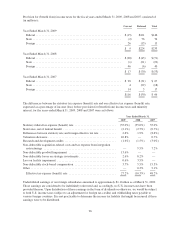
(9) BALANCE SHEET DETAILS
Inventories
Inventories as of March 31, 2009 and 2008 consisted of (in millions):
As of March 31,
2009 2008
Raw materials and work in process .............................................. $ 7 $ 4
In-transit inventory .......................................................... 9 43
Finished goods .............................................................. 201 121
Inventories ............................................................... $ 217 $ 168
Property and Equipment, Net
Property and equipment, net, as of March 31, 2009 and 2008 consisted of (in millions):
As of March 31,
2009 2008
Computer equipment and software .............................................. $ 663 $ 643
Buildings .................................................................. 143 151
Leasehold improvements ...................................................... 125 131
Office equipment, furniture and fixtures .......................................... 63 77
Land ...................................................................... 11 11
Warehouse equipment and other ................................................ 14 11
Construction in progress ...................................................... 16 14
1,035 1,038
Less accumulated depreciation ................................................. (681) (642)
Property and equipment, net ................................................. $ 354 $ 396
In December 2007, we commenced marketing our facility in Chertsey, England for sale. Therefore, as of
March 31, 2008, we reclassified the estimated fair value of the Chertsey facility from property and equipment,
net, to other current assets as an asset held for sale on our Consolidated Balance Sheet. As of March 31, 2009,
although we continue to market our facility in Chertsey, England for sale, for accounting purposes, based on
current market conditions, we have reclassified the estimated fair value of the Chertsey facility from other
current assets as an asset held for sale back to property and equipment, net, on our Consolidated Balance Sheets.
Depreciation expense associated with property and equipment amounted to $117 million, $126 million and $113
million for the fiscal years ended March 31, 2009, 2008 and 2007, respectively.
91