Electronic Arts 2009 Annual Report Download - page 125
Download and view the complete annual report
Please find page 125 of the 2009 Electronic Arts annual report below. You can navigate through the pages in the report by either clicking on the pages listed below, or by using the keyword search tool below to find specific information within the annual report.-
 1
1 -
2
-
3
-
4
-
5
-
6
-
7
-
8
-
9
-
10
-
11
-
12
-
13
-
14
-
15
-
16
-
17
-
18
-
19
-
20
-
21
-
22
-
23
-
24
-
25
-
26
-
27
-
28
-
29
-
30
-
31
-
32
-
33
-
34
-
35
-
36
-
37
-
38
-
39
-
40
-
41
-
42
-
43
-
44
-
45
-
46
-
47
-
48
-
49
-
50
-
51
-
52
-
53
-
54
-
55
-
56
-
57
-
58
-
59
-
60
-
61
-
62
-
63
-
64
-
65
-
66
-
67
-
68
-
69
-
70
-
71
-
72
-
73
-
74
-
75
-
76
-
77
-
78
-
79
-
80
-
81
-
82
-
83
-
84
-
85
-
86
-
87
-
88
-
89
-
90
-
91
-
92
-
93
-
94
-
95
-
96
-
97
-
98
-
99
-
100
-
101
-
102
-
103
-
104
-
105
-
106
-
107
-
108
-
109
-
110
-
111
-
112
-
113
-
114
-
 115
115 -
 116
116 -
 117
117 -
 118
118 -
 119
119 -
 120
120 -
 121
121 -
 122
122 -
 123
123 -
 124
124 -
 125
125 -
 126
126 -
 127
127 -
 128
128 -
 129
129 -
 130
130 -
 131
131 -
 132
132 -
 133
133 -
 134
134 -
 135
135 -
136
-
137
-
138
-
139
-
140
-
141
-
142
-
143
-
144
-
145
-
146
-
147
-
148
-
149
-
150
-
151
-
152
-
153
-
154
-
155
-
156
-
157
-
158
-
159
-
160
-
161
-
162
-
163
-
164
-
165
-
166
-
167
-
168
-
169
-
170
-
171
-
172
-
173
-
174
-
175
-
176
-
177
-
178
-
179
-
180
-
181
-
182
-
183
-
184
-
185
-
186
-
187
-
188
-
189
-
190
-
191
-
192
-
193
-
194
-
195
-
196
-
197
-
198
-
199
-
200
-
201
-
202
-
203
-
204
-
205
-
206
-
207
-
208
 |
 |

Annual Report
Our effective income tax rates for fiscal year 2010 and future periods will depend on a variety of factors,
including changes in the deferred tax valuation allowance, as well as changes in our business such as acquisitions
and intercompany transactions, changes in our international structure, changes in the geographic location of
business functions or assets, changes in the geographic mix of income, changes in or termination of our
agreements with tax authorities, applicable accounting rules, applicable tax laws and regulations, rulings and
interpretations thereof, developments in tax audit and other matters, and variations in our annual pre-tax income
or loss. We incur certain tax expenses that do not decline proportionately with declines in our pre-tax
consolidated income or loss. As a result, in absolute dollar terms, our tax expense will have a greater influence on
our effective tax rate at lower levels of pre-tax income or loss than at higher levels. In addition, at lower levels of
pre-tax income or loss, our effective tax rate will be more volatile.
On May 6, 2009, we received notification from the tax authorities in the United Kingdom that they had
completed their examination of the fiscal 2005 tax return. As a result, in our fiscal quarter ended June 30, 2009,
we will record a tax benefit of approximately $33 million, which includes the recognition of approximately $21
million in previously unrecognized tax benefits, as well as a reduction in our accrual for related interest and
penalties.
We historically have considered undistributed earnings of our foreign subsidiaries to be indefinitely reinvested
outside of the United States and, accordingly, no U.S. taxes have been provided thereon. We currently intend to
continue to indefinitely reinvest the undistributed earnings of our foreign subsidiaries outside of the United
States.
Comparison of Fiscal 2008 to Fiscal 2007
Net Revenue
During fiscal years 2008 and 2007, we recognized total net revenue of $3,665 million and $3,091 million,
respectively. Our total net revenue during fiscal year 2008 includes $831 million recognized from sales of certain
online-enabled packaged goods and digital content for which we were not able to objectively determine the fair
value (as defined by U.S. Generally Accepted Accounting Principles for software sales) of the online service that
we provided in connection with the sale. During the year ended March 31, 2008, we deferred the recognition of
$355 million of net revenue, as compared to the deferral of $10 million of net revenue during the year ended
March 31, 2007.
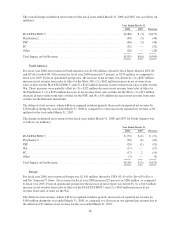
From a geographical perspective, our total net revenue for the fiscal years ended March 31, 2008 and 2007 was
as follows (in millions):
Year Ended March 31,
Increase
%
Change2008 2007
North America ................................. $1,942 53% $1,666 54% $276 17%
Europe ....................................... 1,541 42% 1,261 41% 280 22%
Asia ......................................... 182 5% 164 5% 18 11%
International .................................. 1,723 47% 1,425 46% 298 21%
Total Net Revenue ............................ $3,665 100% $3,091 100% $574 19%
45