Electronic Arts 2009 Annual Report Download - page 118
Download and view the complete annual report
Please find page 118 of the 2009 Electronic Arts annual report below. You can navigate through the pages in the report by either clicking on the pages listed below, or by using the keyword search tool below to find specific information within the annual report.-
 1
1 -
2
-
3
-
4
-
5
-
6
-
7
-
8
-
9
-
10
-
11
-
12
-
13
-
14
-
15
-
16
-
17
-
18
-
19
-
20
-
21
-
22
-
23
-
24
-
25
-
26
-
27
-
28
-
29
-
30
-
31
-
32
-
33
-
34
-
35
-
36
-
37
-
38
-
39
-
40
-
41
-
42
-
43
-
44
-
45
-
46
-
47
-
48
-
49
-
50
-
51
-
52
-
53
-
54
-
55
-
56
-
57
-
58
-
59
-
60
-
61
-
62
-
63
-
64
-
65
-
66
-
67
-
68
-
69
-
70
-
71
-
72
-
73
-
74
-
75
-
76
-
77
-
78
-
79
-
80
-
81
-
82
-
83
-
84
-
85
-
86
-
87
-
88
-
89
-
90
-
91
-
92
-
93
-
94
-
95
-
96
-
97
-
98
-
99
-
100
-
101
-
102
-
103
-
104
-
105
-
106
-
107
-
 108
108 -
 109
109 -
 110
110 -
 111
111 -
 112
112 -
 113
113 -
 114
114 -
 115
115 -
 116
116 -
 117
117 -
 118
118 -
 119
119 -
 120
120 -
 121
121 -
 122
122 -
 123
123 -
 124
124 -
 125
125 -
 126
126 -
 127
127 -
 128
128 -
129
-
130
-
131
-
132
-
133
-
134
-
135
-
136
-
137
-
138
-
139
-
140
-
141
-
142
-
143
-
144
-
145
-
146
-
147
-
148
-
149
-
150
-
151
-
152
-
153
-
154
-
155
-
156
-
157
-
158
-
159
-
160
-
161
-
162
-
163
-
164
-
165
-
166
-
167
-
168
-
169
-
170
-
171
-
172
-
173
-
174
-
175
-
176
-
177
-
178
-
179
-
180
-
181
-
182
-
183
-
184
-
185
-
186
-
187
-
188
-
189
-
190
-
191
-
192
-
193
-
194
-
195
-
196
-
197
-
198
-
199
-
200
-
201
-
202
-
203
-
204
-
205
-
206
-
207
-
208
 |
 |

and the obligation we had to deliver incremental unspecified digital content in the future without an additional
fee. When we refer to deferral of net revenue in this “Net Revenue” section, we mean the deferral of (1) the total
net revenue from bundle sales of certain online-enabled packaged goods and PC digital downloads for which
either we do not have VSOE for the online service that we provide in connection with the sale of the software or
we have an obligation to provide future incremental unspecified digital content, (2) revenue from certain
packaged goods sales of massively-multiplayer online role-playing games, and (3) revenue from the sale of
certain incremental content associated with our core subscription services that can only be played online, which
are types of “micro-transactions.” During the year ended March 31, 2009, we recognized $126 million of
deferred net revenue, which increased our reported net revenue, as compared to the deferral of $355 million of
net revenue, which decreased our reported net revenue for the year ended March 31, 2008.
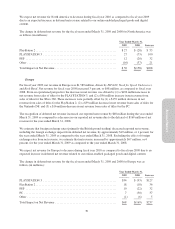
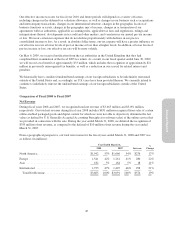
From a geographical perspective, our total net revenue for the fiscal years ended March 31, 2009 and 2008 was
as follows (in millions):
Year Ended March 31,
Increase
%
Change2009 2008
North America ................................. $2,412 57% $1,942 53% $470 24%
Europe ....................................... 1,589 38% 1,541 42% 48 3%
Asia ......................................... 211 5% 182 5% 29 16%
International .................................. 1,800 43% 1,723 47% 77 4%
Total Net Revenue ............................ $4,212 100% $3,665 100% $547 15%
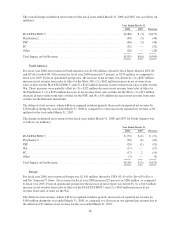
The overall change in deferred net revenue for the fiscal years ended March 31, 2009 and 2008 was as follows (in
millions):
Year Ended March 31, Increase /
(Decrease)2009 2008
PLAYSTATION 3 ................................................. $ 65 $(180) $245
PlayStation 2 ..................................................... 47 (49) 96
PSP............................................................. 23 (46) 69
PC ............................................................. (3) (52) 49
Wii ............................................................. (3) (27) 24
Other ........................................................... (3) (1) (2)
Total Impact on Net Revenue ........................................ $126 $(355) $481
North America
For fiscal year 2009, net revenue in North America was $2,412 million, driven by Rock Band 2, Rock Band, and
Madden NFL 09. Net revenue for fiscal year 2009 increased 24 percent, or $470 million, as compared to fiscal
year 2008. From an operational perspective, the increase in net revenue was driven by (1) a $259 million increase
in net revenue from sales of titles for the Wii, (2) a $168 million increase in net revenue from sales of titles for
the PLAYSTATION 3, and (3) an $85 million increase in net revenue from sales of titles for the Xbox 360.
These increases were partially offset by a decrease of $94 million in net revenue from sales of titles for the
PlayStation 2.
The recognition of deferred net revenue increased our reported net revenue by $50 million during the year ended
March 31, 2009, as compared to a decrease in our reported net revenue of $158 million for the year ended
March 31, 2008.
38