Electronic Arts 2009 Annual Report Download - page 60
Download and view the complete annual report
Please find page 60 of the 2009 Electronic Arts annual report below. You can navigate through the pages in the report by either clicking on the pages listed below, or by using the keyword search tool below to find specific information within the annual report.-
 1
1 -
2
-
3
-
4
-
5
-
6
-
7
-
8
-
9
-
10
-
11
-
12
-
13
-
14
-
15
-
16
-
17
-
18
-
19
-
20
-
21
-
22
-
23
-
24
-
25
-
26
-
27
-
28
-
29
-
30
-
31
-
32
-
33
-
34
-
35
-
36
-
37
-
38
-
39
-
40
-
41
-
42
-
43
-
44
-
45
-
46
-
47
-
48
-
49
-
 50
50 -
 51
51 -
 52
52 -
 53
53 -
 54
54 -
 55
55 -
 56
56 -
 57
57 -
 58
58 -
 59
59 -
 60
60 -
 61
61 -
 62
62 -
 63
63 -
 64
64 -
 65
65 -
 66
66 -
 67
67 -
 68
68 -
 69
69 -
 70
70 -
71
-
72
-
73
-
74
-
75
-
76
-
77
-
78
-
79
-
80
-
81
-
82
-
83
-
84
-
85
-
86
-
87
-
88
-
89
-
90
-
91
-
92
-
93
-
94
-
95
-
96
-
97
-
98
-
99
-
100
-
101
-
102
-
103
-
104
-
105
-
106
-
107
-
108
-
109
-
110
-
111
-
112
-
113
-
114
-
115
-
116
-
117
-
118
-
119
-
120
-
121
-
122
-
123
-
124
-
125
-
126
-
127
-
128
-
129
-
130
-
131
-
132
-
133
-
134
-
135
-
136
-
137
-
138
-
139
-
140
-
141
-
142
-
143
-
144
-
145
-
146
-
147
-
148
-
149
-
150
-
151
-
152
-
153
-
154
-
155
-
156
-
157
-
158
-
159
-
160
-
161
-
162
-
163
-
164
-
165
-
166
-
167
-
168
-
169
-
170
-
171
-
172
-
173
-
174
-
175
-
176
-
177
-
178
-
179
-
180
-
181
-
182
-
183
-
184
-
185
-
186
-
187
-
188
-
189
-
190
-
191
-
192
-
193
-
194
-
195
-
196
-
197
-
198
-
199
-
200
-
201
-
202
-
203
-
204
-
205
-
206
-
207
-
208
 |
 |

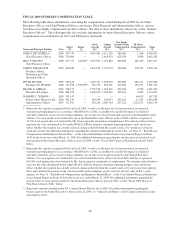
FISCAL 2009 OPTION EXERCISES AND STOCK VESTED TABLE
The following table shows all stock options exercised and value realized upon exercise and all restricted stock
units vested and value realized upon vesting by the Named Executive Officers during fiscal 2009.
Option Awards Stock Awards
Name
Number of
Shares Acquired
on Exercise
(#)
Value Realized
on Exercise
($)
Number of
Shares Acquired
on Vesting
(#)(1)
Value Realized
on Vesting
($)(2)
John S. Riccitiello ......................... — — — —
Eric F. Brown ............................ — — — —
John F. Pleasants ......................... — — 18,750 324,563
Peter Moore ............................. — — — —
Frank D. Gibeau .......................... — — 22,499 922,657
Warren C. Jenson ......................... — — 11,250 491,450
(1) Represents restricted stock units that vested during fiscal 2009. Shares of EA common stock, net of shares
withheld for tax purposes, are issued upon vesting of restricted stock units.
(2) The value realized upon vesting of restricted stock units is calculated by multiplying the number of restricted
stock units vested by the closing price of EA common stock on the vest date.
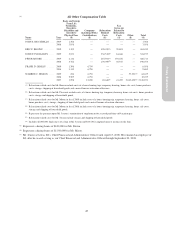
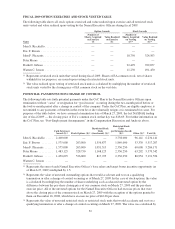
POTENTIAL PAYMENTS UPON CHANGE OF CONTROL
The following table sets forth potential payments under the CoC Plan to the Named Executive Officers upon
termination without “cause” or resignation for “good reason” occurring during the two-month period before or
the twelve-month period after a change in control of the company. Under the CoC Plan, an eligible employee is
not entitled to any payments or benefits in the event he or she voluntarily resigns or is terminated for cause. For
purposes of the table below, we have assumed a termination date of March 27, 2009, the last NASDAQ trading
day of fiscal 2009 — the closing price of EA’s common stock on that day was $18.69. For further information on
the CoC Plan, see “Post-Employment Arrangements” in the Compensation Discussion and Analysis above.
Cash Severance
Award ($)(1) Stock Options ($)(2)
Restricted Stock
Units
(time-based) ($)(3)
Restricted Stock
Units
(performance-based)
($)(4) Other ($)(5) Total ($)
John S. Riccitiello ..... 2,400,000 — — 3,738,000 96,141 6,234,141
Eric F. Brown ........ 1,575,000 263,000 1,556,877 1,869,000 53,330 5,317,207
John F. Pleasants ...... 1,575,000 263,000 1,051,313 2,336,250 60,608 5,286,171
Peter Moore .......... 1,483,125 328,750 1,168,125 2,336,250 63,292 5,379,542
Frank D. Gibeau ...... 1,430,625 526,000 817,725 2,336,250 80,954 5,191,554
Warren C. Jenson ..... — — — — — —
(1) Represents the sum of each Named Executive Officer’s base salary and target bonus incentive opportunity (as
of March 27, 2009) multiplied by 1.5.
(2) Represents the value of unvested outstanding options that would accelerate and vest on a qualifying
termination or after a change of control occurring as of March 27, 2009. In the case of stock options, the value
is calculated by multiplying the number of shares underlying each accelerated unvested option by the
difference between the per-share closing price of our common stock on March 27, 2009 and the per-share
exercise price. All of the unvested options for the Named Executive Officers had exercise prices that were
above the closing price of the common stock on March 27, 2009 with the exception of the options granted to
them on December 16, 2008, which have an exercise price of $16.06 per share.
(3) Represents the value of unvested restricted stock or restricted stock units that would accelerate and vest on a
qualifying termination or after a change of control occurring on March 27, 2009. The value was calculated by
52