Electronic Arts 2009 Annual Report Download - page 191
Download and view the complete annual report
Please find page 191 of the 2009 Electronic Arts annual report below. You can navigate through the pages in the report by either clicking on the pages listed below, or by using the keyword search tool below to find specific information within the annual report.-
 1
1 -
2
-
3
-
4
-
5
-
6
-
7
-
8
-
9
-
10
-
11
-
12
-
13
-
14
-
15
-
16
-
17
-
18
-
19
-
20
-
21
-
22
-
23
-
24
-
25
-
26
-
27
-
28
-
29
-
30
-
31
-
32
-
33
-
34
-
35
-
36
-
37
-
38
-
39
-
40
-
41
-
42
-
43
-
44
-
45
-
46
-
47
-
48
-
49
-
50
-
51
-
52
-
53
-
54
-
55
-
56
-
57
-
58
-
59
-
60
-
61
-
62
-
63
-
64
-
65
-
66
-
67
-
68
-
69
-
70
-
71
-
72
-
73
-
74
-
75
-
76
-
77
-
78
-
79
-
80
-
81
-
82
-
83
-
84
-
85
-
86
-
87
-
88
-
89
-
90
-
91
-
92
-
93
-
94
-
95
-
96
-
97
-
98
-
99
-
100
-
101
-
102
-
103
-
104
-
105
-
106
-
107
-
108
-
109
-
110
-
111
-
112
-
113
-
114
-
115
-
116
-
117
-
118
-
119
-
120
-
121
-
122
-
123
-
124
-
125
-
126
-
127
-
128
-
129
-
130
-
131
-
132
-
133
-
134
-
135
-
136
-
137
-
138
-
139
-
140
-
141
-
142
-
143
-
144
-
145
-
146
-
147
-
148
-
149
-
150
-
151
-
152
-
153
-
154
-
155
-
156
-
157
-
158
-
159
-
160
-
161
-
162
-
163
-
164
-
165
-
166
-
167
-
168
-
169
-
170
-
171
-
172
-
173
-
174
-
175
-
176
-
177
-
178
-
179
-
180
-
 181
181 -
 182
182 -
 183
183 -
 184
184 -
 185
185 -
 186
186 -
 187
187 -
 188
188 -
 189
189 -
 190
190 -
 191
191 -
 192
192 -
 193
193 -
 194
194 -
 195
195 -
 196
196 -
 197
197 -
 198
198 -
 199
199 -
 200
200 -
 201
201 -
202
-
203
-
204
-
205
-
206
-
207
-
208
 |
 |

Annual Report
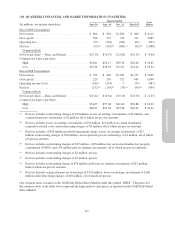
(20) QUARTERLY FINANCIAL AND MARKET INFORMATION (UNAUDITED)
Quarter Ended Year
Ended(In millions, except per share data) June 30 Sept. 30 Dec. 31 March 31
Fiscal 2009 Consolidated
Net revenue ................................... $ 804 $ 894 $1,654 $ 860 $ 4,212
Gross profit ................................... 508 337 729 511 2,085
Operating loss ................................. (97) (364) (304) (62) (827)
Net loss ....................................... (95)(a) (310)(b) (641)(c) (42)(d) (1,088)
Common Stock
Net loss per share — Basic and Diluted ............. $(0.30) $ (0.97) $ (2.00) $ (0.13) $ (3.40)
Common stock price per share
High ....................................... $54.81 $50.17 $39.56 $20.60 $ 54.81
Low ....................................... $43.46 $38.36 $15.01 $14.24 $ 14.24
Fiscal 2008 Consolidated
Net revenue ................................... $ 395 $ 640 $1,503 $1,127 $ 3,665
Gross profit ................................... 229 245 721 665 1,860
Operating income (loss) .......................... (183) (274) 7 (37) (487)
Net loss ....................................... (132)(e) (195)(f) (33)(g) (94)(h) (454)
Common Stock
Net loss per share — Basic and Diluted ............. $(0.42) $ (0.62) $ (0.10) $ (0.30) $ (1.45)
Common stock price per share
High ....................................... $54.67 $57.08 $61.62 $58.88 $ 61.62
Low ....................................... $46.27 $47.54 $53.28 $43.62 $ 43.62
(a) Net loss includes restructuring charges of $20 million, losses on strategic investments of $6 million, and
acquired in-process technology of $2 million, all of which are pre-tax amounts.
(b) Net loss includes losses on strategic investments of $34 million, $21 million of certain abandoned
acquisition-related costs, and restructuring charges of $3 million, all of which are pre-tax amounts.
(c) Net loss includes a $368 million goodwill impairment charge, losses on strategic investments of $27
million, restructuring charges of $18 million, and acquired in-process technology of $1 million, all of which
are pre-tax amounts.
(d) Net loss includes restructuring charges of $39 million, a $38 million loss on licensed intellectual property
commitment (COGS), and a $5 million gain on strategic investments, all of which are pre-tax amounts.
(e) Net loss includes restructuring charges of $2 million, pre-tax.
(f) Net loss includes restructuring charges of $5 million, pre-tax.
(g) Net loss includes restructuring charge of $78 million and losses on strategic investments of $12 million,
both of which are pre-tax amounts.
(h) Net loss includes acquired in-process technology of $138 million, losses on strategic investments of $106
million and restructuring charges of $18 million, all of which are pre-tax.
Our common stock is traded on the NASDAQ Global Select Market under the symbol “ERTS.” The prices for
the common stock in the table above represent the high and low sales prices as reported on the NASDAQ Global
Select Market.
111