Electronic Arts 2009 Annual Report Download - page 127
Download and view the complete annual report
Please find page 127 of the 2009 Electronic Arts annual report below. You can navigate through the pages in the report by either clicking on the pages listed below, or by using the keyword search tool below to find specific information within the annual report.-
 1
1 -
2
-
3
-
4
-
5
-
6
-
7
-
8
-
9
-
10
-
11
-
12
-
13
-
14
-
15
-
16
-
17
-
18
-
19
-
20
-
21
-
22
-
23
-
24
-
25
-
26
-
27
-
28
-
29
-
30
-
31
-
32
-
33
-
34
-
35
-
36
-
37
-
38
-
39
-
40
-
41
-
42
-
43
-
44
-
45
-
46
-
47
-
48
-
49
-
50
-
51
-
52
-
53
-
54
-
55
-
56
-
57
-
58
-
59
-
60
-
61
-
62
-
63
-
64
-
65
-
66
-
67
-
68
-
69
-
70
-
71
-
72
-
73
-
74
-
75
-
76
-
77
-
78
-
79
-
80
-
81
-
82
-
83
-
84
-
85
-
86
-
87
-
88
-
89
-
90
-
91
-
92
-
93
-
94
-
95
-
96
-
97
-
98
-
99
-
100
-
101
-
102
-
103
-
104
-
105
-
106
-
107
-
108
-
109
-
110
-
111
-
112
-
113
-
114
-
115
-
116
-
 117
117 -
 118
118 -
 119
119 -
 120
120 -
 121
121 -
 122
122 -
 123
123 -
 124
124 -
 125
125 -
 126
126 -
 127
127 -
 128
128 -
 129
129 -
 130
130 -
 131
131 -
 132
132 -
 133
133 -
 134
134 -
 135
135 -
 136
136 -
 137
137 -
138
-
139
-
140
-
141
-
142
-
143
-
144
-
145
-
146
-
147
-
148
-
149
-
150
-
151
-
152
-
153
-
154
-
155
-
156
-
157
-
158
-
159
-
160
-
161
-
162
-
163
-
164
-
165
-
166
-
167
-
168
-
169
-
170
-
171
-
172
-
173
-
174
-
175
-
176
-
177
-
178
-
179
-
180
-
181
-
182
-
183
-
184
-
185
-
186
-
187
-
188
-
189
-
190
-
191
-
192
-
193
-
194
-
195
-
196
-
197
-
198
-
199
-
200
-
201
-
202
-
203
-
204
-
205
-
206
-
207
-
208
 |
 |

Annual Report
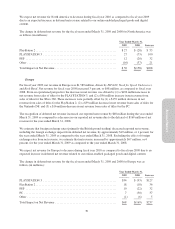
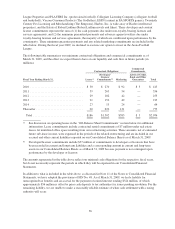
We estimate that foreign exchange rates (primarily the Euro and the British pound sterling) increased reported
net revenue, including the foreign exchange impact from deferred net revenue, by approximately $113 million, or
9 percent, for the year ended March 31, 2008 as compared to the year ended March 31, 2007. Excluding the
effect of foreign exchange rates from net revenue, we estimate that net revenue increased by approximately $167
million, or 13 percent, for the year ended March 31, 2008 as compared to the year ended March 31, 2007.
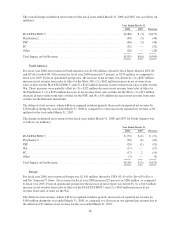
The change in deferred net revenue for the fiscal years ended March 31, 2008 and 2007 for Europe was as
follows (in millions):
Year Ended March 31,
Decrease2008 2007
PLAYSTATION 3 .................................................. $ (93) $ (1) $ (92)
PC .............................................................. (30) (2) (28)
PSP.............................................................. (22) (1) (21)
PlayStation 2 ...................................................... (18) (1) (17)
Other ............................................................ (6) — (6)
Total Impact on Net Revenue ......................................... $(169) $ (5) $(164)
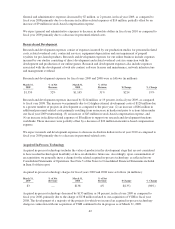
Asia
For fiscal year 2008, net revenue in Asia was $182 million, driven by Need for Speed ProStreet,The Simpsons
Game, and FIFA 08. Net revenue for fiscal year 2008 increased 11 percent, or $18 million, as compared to fiscal
year 2007. From an operational perspective, the increase in net revenue was driven by (1) a $15 million increase
in net revenue from sales of titles for the PLAYSTATION 3 and (2) a $12 million increase in net revenue from
sales of titles for the Wii. These increases were partially offset by a $9 million decrease in net revenue from sales
of titles for the PlayStation 2.
The deferral of net revenue, which will be recognized in future periods, decreased our reported net revenue by
$28 million during the year ended March 31, 2008.
We estimate that foreign exchange rates (particularly the Australian dollar) increased reported net revenue,
including the foreign exchange impact from deferred net revenue, by approximately $12 million, or 7 percent, for
the year ended March 31, 2008 as compared to the year ended March 31, 2007. Excluding the effect of foreign
exchange rates from net revenue, we estimate that net revenue increased by approximately $6 million, or 4
percent, for the year ended March 31, 2008 as compared to the year ended March 31, 2007.
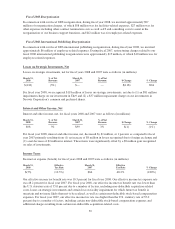
The change in deferred net revenue for the fiscal years ended March 31, 2008 and 2007 for Asia was as follows
(in millions):
Year Ended March 31,
Decrease2008 2007
PLAYSTATION 3 .................................................. $(14) $— $(14)
PC .............................................................. (5) — (5)
Other ............................................................ (9) — (9)
Total Impact on Net Revenue ......................................... $(28) $— $(28)
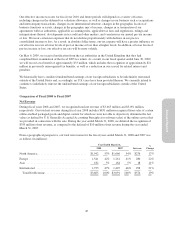
Cost of Goods Sold
Cost of goods sold for fiscal years 2008 and 2007 were as follows (in millions):
March 31,
2008
% of Net
Revenue
March 31,
2007
% of Net
Revenue % Change
Change as a
% of Net
Revenue
$1,805 49.3% $1,212 39.2% 48.9% 10.1%
47