Electronic Arts 2009 Annual Report Download - page 150
Download and view the complete annual report
Please find page 150 of the 2009 Electronic Arts annual report below. You can navigate through the pages in the report by either clicking on the pages listed below, or by using the keyword search tool below to find specific information within the annual report.-
 1
1 -
2
-
3
-
4
-
5
-
6
-
7
-
8
-
9
-
10
-
11
-
12
-
13
-
14
-
15
-
16
-
17
-
18
-
19
-
20
-
21
-
22
-
23
-
24
-
25
-
26
-
27
-
28
-
29
-
30
-
31
-
32
-
33
-
34
-
35
-
36
-
37
-
38
-
39
-
40
-
41
-
42
-
43
-
44
-
45
-
46
-
47
-
48
-
49
-
50
-
51
-
52
-
53
-
54
-
55
-
56
-
57
-
58
-
59
-
60
-
61
-
62
-
63
-
64
-
65
-
66
-
67
-
68
-
69
-
70
-
71
-
72
-
73
-
74
-
75
-
76
-
77
-
78
-
79
-
80
-
81
-
82
-
83
-
84
-
85
-
86
-
87
-
88
-
89
-
90
-
91
-
92
-
93
-
94
-
95
-
96
-
97
-
98
-
99
-
100
-
101
-
102
-
103
-
104
-
105
-
106
-
107
-
108
-
109
-
110
-
111
-
112
-
113
-
114
-
115
-
116
-
117
-
118
-
119
-
120
-
121
-
122
-
123
-
124
-
125
-
126
-
127
-
128
-
129
-
130
-
131
-
132
-
133
-
134
-
135
-
136
-
137
-
138
-
139
-
 140
140 -
 141
141 -
 142
142 -
 143
143 -
 144
144 -
 145
145 -
 146
146 -
 147
147 -
 148
148 -
 149
149 -
 150
150 -
 151
151 -
 152
152 -
 153
153 -
 154
154 -
 155
155 -
 156
156 -
 157
157 -
 158
158 -
 159
159 -
 160
160 -
161
-
162
-
163
-
164
-
165
-
166
-
167
-
168
-
169
-
170
-
171
-
172
-
173
-
174
-
175
-
176
-
177
-
178
-
179
-
180
-
181
-
182
-
183
-
184
-
185
-
186
-
187
-
188
-
189
-
190
-
191
-
192
-
193
-
194
-
195
-
196
-
197
-
198
-
199
-
200
-
201
-
202
-
203
-
204
-
205
-
206
-
207
-
208
 |
 |
Under the provisions of American Institute of Certified Public Accountants Statement of Position (“SOP”) 98-1,
Accounting for the Costs of Computer Software Developed or Obtained for Internal Use, we capitalize costs
associated with customized internal-use software systems that have reached the application development stage
and meet recoverability tests. Such capitalized costs include external direct costs utilized in developing or
obtaining the applications and payroll and payroll-related expenses for employees, who are directly associated
with the development of the applications. Capitalization of such costs begins when the preliminary project stage
is complete and ceases at the point in which the project is substantially complete and ready for its intended
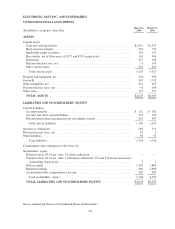
purpose. The net book value of capitalized costs associated with internal-use software amounted to $24 million
as of March 31, 2009 and 2008 in each year, and are being depreciated on a straight-line basis over each asset’s
estimated useful life, which is generally three years.
Long-Lived Assets
We evaluate long-lived assets and certain identifiable intangibles for impairment, in accordance with SFAS
No. 144, Accounting for the Impairment or Disposal of Long-Lived Assets, whenever events or changes in
circumstances indicate that the carrying amount of an asset may not be recoverable. Recoverability of assets is
measured by a comparison of the carrying amount of an asset to future undiscounted net cash flows expected to
be generated by the asset. This may include assumptions about future prospects for the business that the asset
relates to and typically involves computations of the estimated future cash flows to be generated by these
businesses. Based on these judgments and assumptions, we determine whether we need to take an impairment
charge to reduce the value of the asset stated on our Consolidated Balance Sheets to reflect its estimated fair
value. Judgments and assumptions about future values and remaining useful lives are complex and often
subjective. They can be affected by a variety of factors, including but not limited to, significant negative industry
or economic trends, significant changes in the manner of our use of the acquired assets or the strategy of our
overall business and significant under-performance relative to expected historical or projected future operating
results. If we were to consider such assets to be impaired, the amount of impairment we recognize would be
measured by the amount by which the carrying amount of the asset exceeds its fair value. We recognized $25
million and $56 million in impairment charges in fiscal years 2009 and 2008, respectively. These charges are
included in restructuring charges on our Consolidated Statements of Operations. Impairment charges were
insignificant in fiscal year 2007.
Goodwill
We evaluate goodwill for impairment in accordance with SFAS No. 142, Goodwill and Other Intangible Assets.
SFAS No. 142 requires a two-step approach to testing goodwill for impairment for each reporting unit. The first
step measures for impairment by applying fair-value-based tests at the reporting unit level. The second step (if
necessary) measures the amount of impairment by applying fair-value-based tests to the individual assets and
liabilities within each reporting unit.
To determine the fair values of the reporting units used in the first step, we use a combination of the market
approach, which utilizes comparable companies’ data, and/or the income approach, which uses discounted cash
flows. Each step requires us to make judgments and involves the use of significant estimates and assumptions.
These estimates and assumptions include long-term growth rates and operating margins used to calculate
projected future cash flows, risk-adjusted discount rates based on our weighted average cost of capital, future
economic and market conditions and the determination of appropriate market comparables. These estimates and
assumptions have to be made for each reporting unit evaluated for impairment. Our estimates for market growth,
our market share and costs are based on historical data, various internal estimates and certain external sources,
and are based on assumptions that are consistent with the plans and estimates we use to manage the underlying
business. Our business consists of developing, marketing and distributing video game software using both
established and emerging intellectual properties and our forecasts for emerging intellectual properties are based
upon internal estimates and external sources rather than historical information and have an inherently higher risk
of accuracy. If future forecasts are revised, they may indicate or require future impairment charges. We base our
fair value estimates on assumptions we believe to be reasonable but these assumptions are inherently uncertain
and subject to change. Actual future results may differ from those estimates.
70