Electronic Arts 2009 Annual Report Download - page 120
Download and view the complete annual report
Please find page 120 of the 2009 Electronic Arts annual report below. You can navigate through the pages in the report by either clicking on the pages listed below, or by using the keyword search tool below to find specific information within the annual report.-
 1
1 -
2
-
3
-
4
-
5
-
6
-
7
-
8
-
9
-
10
-
11
-
12
-
13
-
14
-
15
-
16
-
17
-
18
-
19
-
20
-
21
-
22
-
23
-
24
-
25
-
26
-
27
-
28
-
29
-
30
-
31
-
32
-
33
-
34
-
35
-
36
-
37
-
38
-
39
-
40
-
41
-
42
-
43
-
44
-
45
-
46
-
47
-
48
-
49
-
50
-
51
-
52
-
53
-
54
-
55
-
56
-
57
-
58
-
59
-
60
-
61
-
62
-
63
-
64
-
65
-
66
-
67
-
68
-
69
-
70
-
71
-
72
-
73
-
74
-
75
-
76
-
77
-
78
-
79
-
80
-
81
-
82
-
83
-
84
-
85
-
86
-
87
-
88
-
89
-
90
-
91
-
92
-
93
-
94
-
95
-
96
-
97
-
98
-
99
-
100
-
101
-
102
-
103
-
104
-
105
-
106
-
107
-
108
-
109
-
 110
110 -
 111
111 -
 112
112 -
 113
113 -
 114
114 -
 115
115 -
 116
116 -
 117
117 -
 118
118 -
 119
119 -
 120
120 -
 121
121 -
 122
122 -
 123
123 -
 124
124 -
 125
125 -
 126
126 -
 127
127 -
 128
128 -
 129
129 -
 130
130 -
131
-
132
-
133
-
134
-
135
-
136
-
137
-
138
-
139
-
140
-
141
-
142
-
143
-
144
-
145
-
146
-
147
-
148
-
149
-
150
-
151
-
152
-
153
-
154
-
155
-
156
-
157
-
158
-
159
-
160
-
161
-
162
-
163
-
164
-
165
-
166
-
167
-
168
-
169
-
170
-
171
-
172
-
173
-
174
-
175
-
176
-
177
-
178
-
179
-
180
-
181
-
182
-
183
-
184
-
185
-
186
-
187
-
188
-
189
-
190
-
191
-
192
-
193
-
194
-
195
-
196
-
197
-
198
-
199
-
200
-
201
-
202
-
203
-
204
-
205
-
206
-
207
-
208
 |
 |

Asia
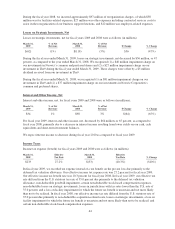
For fiscal year 2009, net revenue in Asia was $211 million, driven by FIFA 09, Need for Speed Undercover, and
Need for Speed ProStreet. Net revenue for fiscal year 2009 increased 16 percent, or $29 million, as compared to
fiscal year 2008. From an operational perspective, the increase in net revenue was driven by a $29 million
increase in net revenue from sales of titles for the PLAYSTATION 3.
The recognition of deferred net revenue increased our reported net revenue by $8 million during the year ended
March 31, 2009 as compared to a decrease in our reported net revenue due to the deferral of $28 million of net
revenue for the year ended March 31, 2008.
We estimate that foreign exchange rates (particularly the Australian dollar) decreased reported net revenue,
including the foreign exchange impact from deferred net revenue, by approximately $10 million, or 5 percent, for
the year ended March 31, 2009 as compared to the year ended March 31, 2008. Excluding the effect of foreign
exchange rates from net revenue, we estimate that net revenue increased by approximately $39 million, or 21
percent, for the year ended March 31, 2009 as compared to the year ended March 31, 2008.
We continue to expect net revenue for Asia to increase during fiscal year 2010 as compared to fiscal year 2009
due to continued growth, partially off-set by an expected increase in deferred net revenue related to our online-
enabled packaged goods and digital content.
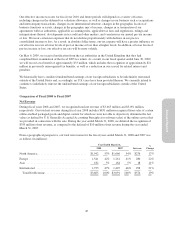
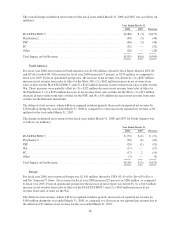
The change in deferred net revenue for the fiscal years ended March 31, 2009 and 2008 for Asia was as follows
(in millions):
Year Ended March 31,
Increase2009 2008
PLAYSTATION 3 .................................................. $ 4 $(14) $18
PlayStation 2 ....................................................... 2 (3) 5
PC ............................................................... 1 (5) 6
PSP .............................................................. 1 (4) 5
Wii .............................................................. — (2) 2
Total Impact on Net Revenue .......................................... $ 8 $(28) $36
Cost of Goods Sold
Cost of goods sold for our packaged-goods business consists of (1) product costs, (2) certain royalty expenses for
celebrities, professional sports and other organizations and independent software developers, (3) manufacturing
royalties, net of volume discounts and other vendor reimbursements, (4) expenses for defective products,
(5) write-offs of post-launch prepaid royalty costs, (6) amortization of certain intangible assets, (7) personnel-
related costs, and (8) distribution costs. We generally recognize volume discounts when they are earned from the
manufacturer (typically in connection with the achievement of unit-based milestones), whereas other vendor
reimbursements are generally recognized as the related revenue is recognized. Cost of goods sold for our online
products consists primarily of data center and bandwidth costs associated with hosting our web sites, credit card
fees and royalties for use of third-party properties. Cost of goods sold for our web site advertising business
primarily consists of server costs.
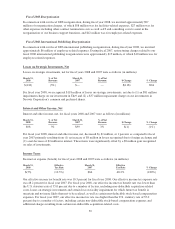
Cost of goods sold for fiscal years 2009 and 2008 were as follows (in millions):
March 31,
2009
% of Net
Revenue
March 31,
2008
% of Net
Revenue % Change
Change as a
% of Net
Revenue
$2,127 50.5% $1,805 49.3% 17.8% 1.2%
40