Electronic Arts 2009 Annual Report Download - page 167
Download and view the complete annual report
Please find page 167 of the 2009 Electronic Arts annual report below. You can navigate through the pages in the report by either clicking on the pages listed below, or by using the keyword search tool below to find specific information within the annual report.-
 1
1 -
2
-
3
-
4
-
5
-
6
-
7
-
8
-
9
-
10
-
11
-
12
-
13
-
14
-
15
-
16
-
17
-
18
-
19
-
20
-
21
-
22
-
23
-
24
-
25
-
26
-
27
-
28
-
29
-
30
-
31
-
32
-
33
-
34
-
35
-
36
-
37
-
38
-
39
-
40
-
41
-
42
-
43
-
44
-
45
-
46
-
47
-
48
-
49
-
50
-
51
-
52
-
53
-
54
-
55
-
56
-
57
-
58
-
59
-
60
-
61
-
62
-
63
-
64
-
65
-
66
-
67
-
68
-
69
-
70
-
71
-
72
-
73
-
74
-
75
-
76
-
77
-
78
-
79
-
80
-
81
-
82
-
83
-
84
-
85
-
86
-
87
-
88
-
89
-
90
-
91
-
92
-
93
-
94
-
95
-
96
-
97
-
98
-
99
-
100
-
101
-
102
-
103
-
104
-
105
-
106
-
107
-
108
-
109
-
110
-
111
-
112
-
113
-
114
-
115
-
116
-
117
-
118
-
119
-
120
-
121
-
122
-
123
-
124
-
125
-
126
-
127
-
128
-
129
-
130
-
131
-
132
-
133
-
134
-
135
-
136
-
137
-
138
-
139
-
140
-
141
-
142
-
143
-
144
-
145
-
146
-
147
-
148
-
149
-
150
-
151
-
152
-
153
-
154
-
155
-
156
-
 157
157 -
 158
158 -
 159
159 -
 160
160 -
 161
161 -
 162
162 -
 163
163 -
 164
164 -
 165
165 -
 166
166 -
 167
167 -
 168
168 -
 169
169 -
 170
170 -
 171
171 -
 172
172 -
 173
173 -
 174
174 -
 175
175 -
 176
176 -
 177
177 -
178
-
179
-
180
-
181
-
182
-
183
-
184
-
185
-
186
-
187
-
188
-
189
-
190
-
191
-
192
-
193
-
194
-
195
-
196
-
197
-
198
-
199
-
200
-
201
-
202
-
203
-
204
-
205
-
206
-
207
-
208
 |
 |

Annual Report
amount. Our reporting units are determined by the components of our operating segments that constitute a
business for which both (1) discrete financial information is available and (2) segment management regularly
reviews the operating results of that component. The first step measures for impairment by applying fair value-
based tests at the reporting unit level. The second step (if necessary) measures the amount of impairment by
applying fair value-based tests to individual assets and liabilities within each reporting unit. The fair values of the
reporting units are estimated using a combination of the market approach, which utilizes comparable companies’
data, and/or the income approach, which uses discounted cash flows.
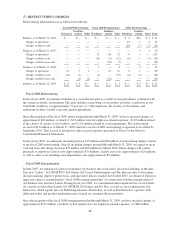
Adverse economic conditions, including the decline in our market capitalization and our expected financial
performance, indicated that a potential impairment of goodwill existed during the third quarter of the fiscal year
ended March 31, 2009. As a result, we completed the first step of the goodwill impairment testing in that quarter
and determined that the fair value of our EA Mobile reporting unit fell below the carrying value of that reporting
unit. As a result, we conducted the second step in accordance with SFAS No. 142 and determined that the EA
Mobile reporting unit’s goodwill was impaired. The fair value of the EA Mobile reporting unit was determined
using the income approach. Substantially all of our goodwill associated with our EA Mobile reporting unit was
derived from our acquisition of JAMDAT Mobile Inc. in February 2006. During the fiscal year ended March 31,
2009, we recognized a goodwill impairment charge of $368 million related to our EA Mobile reporting unit.
During the fourth quarter of fiscal year 2009, we completed the first step of our annual goodwill impairment test
and found no indicators of impairment. See Note 18 for information regarding our segment information.
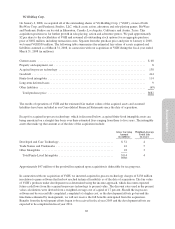
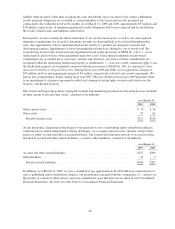
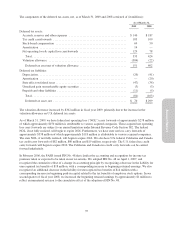
Finite-lived intangible assets, net of accumulated amortization, as of March 31, 2009 and 2008, were $221
million and $265 million, respectively, and include costs for obtaining (1) developed and core technologies,
(2) carrier contracts and related, (3) trade names, and (4) subscribers and other intangibles. Amortization of
intangibles for fiscal years 2009, 2008 and 2007 was $72 million (of which $14 million was recognized in cost of
goods sold), $60 million (of which $26 million was recognized in cost of goods sold) and $54 million (of which
$27 million was recognized in cost of goods sold), respectively. Finite-lived intangible assets are amortized using
the straight-line method over the lesser of their estimated useful lives or the agreement terms, typically from two
to fifteen years. As of March 31, 2009 and 2008, the weighted-average remaining useful life for finite-lived
intangible assets was approximately 6.0 years and 5.2 years, respectively.
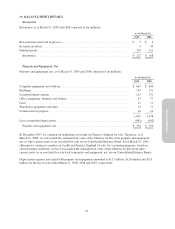
Finite-lived intangibles consisted of the following (in millions):
As of March 31, 2009 As of March 31, 2008
Gross
Carrying
Amount
Accumulated
Amortization
Other
Intangibles,
Net
Gross
Carrying
Amount
Accumulated
Amortization
Other
Intangibles,
Net
Developed and Core Technology ..... $249 $(128) $121 $234 $ (95) $139
Trade Name ...................... 86 (43) 43 86 (30) 56
Carrier Contracts and Related ........ 85 (51) 34 85 (36) 49
Subscribers and Other Intangibles ..... 51 (28) 23 38 (17) 21
Total .......................... $471 $(250) $221 $443 $(178) $265
As of March 31, 2009, future amortization of finite-lived intangibles that will be recorded in cost of goods sold
and operating expenses is estimated as follows (in millions):
Fiscal Year Ending March 31,
2010 ............................................................................... $ 56
2011 ............................................................................... 51
2012 ............................................................................... 36
2013 ............................................................................... 21
2014 ............................................................................... 14
Thereafter .......................................................................... 43
Total ............................................................................ $221
87