Electronic Arts 2009 Annual Report Download - page 133
Download and view the complete annual report
Please find page 133 of the 2009 Electronic Arts annual report below. You can navigate through the pages in the report by either clicking on the pages listed below, or by using the keyword search tool below to find specific information within the annual report.-
 1
1 -
2
-
3
-
4
-
5
-
6
-
7
-
8
-
9
-
10
-
11
-
12
-
13
-
14
-
15
-
16
-
17
-
18
-
19
-
20
-
21
-
22
-
23
-
24
-
25
-
26
-
27
-
28
-
29
-
30
-
31
-
32
-
33
-
34
-
35
-
36
-
37
-
38
-
39
-
40
-
41
-
42
-
43
-
44
-
45
-
46
-
47
-
48
-
49
-
50
-
51
-
52
-
53
-
54
-
55
-
56
-
57
-
58
-
59
-
60
-
61
-
62
-
63
-
64
-
65
-
66
-
67
-
68
-
69
-
70
-
71
-
72
-
73
-
74
-
75
-
76
-
77
-
78
-
79
-
80
-
81
-
82
-
83
-
84
-
85
-
86
-
87
-
88
-
89
-
90
-
91
-
92
-
93
-
94
-
95
-
96
-
97
-
98
-
99
-
100
-
101
-
102
-
103
-
104
-
105
-
106
-
107
-
108
-
109
-
110
-
111
-
112
-
113
-
114
-
115
-
116
-
117
-
118
-
119
-
120
-
121
-
122
-
 123
123 -
 124
124 -
 125
125 -
 126
126 -
 127
127 -
 128
128 -
 129
129 -
 130
130 -
 131
131 -
 132
132 -
 133
133 -
 134
134 -
 135
135 -
 136
136 -
 137
137 -
 138
138 -
 139
139 -
 140
140 -
 141
141 -
 142
142 -
 143
143 -
144
-
145
-
146
-
147
-
148
-
149
-
150
-
151
-
152
-
153
-
154
-
155
-
156
-
157
-
158
-
159
-
160
-
161
-
162
-
163
-
164
-
165
-
166
-
167
-
168
-
169
-
170
-
171
-
172
-
173
-
174
-
175
-
176
-
177
-
178
-
179
-
180
-
181
-
182
-
183
-
184
-
185
-
186
-
187
-
188
-
189
-
190
-
191
-
192
-
193
-
194
-
195
-
196
-
197
-
198
-
199
-
200
-
201
-
202
-
203
-
204
-
205
-
206
-
207
-
208
 |
 |

Annual Report
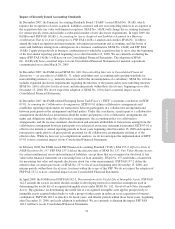
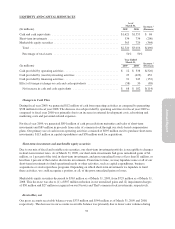
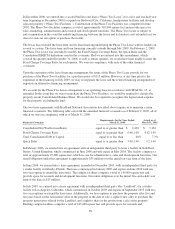
LIQUIDITY AND CAPITAL RESOURCES
As of
March 31, Increase /
(Decrease)(In millions) 2009 2008
Cash and cash equivalents ............................................. $1,621 $1,553 $ 68
Short-term investments ................................................ 534 734 (200)
Marketable equity securities ............................................ 365 729 (364)
Total ............................................................ $2,520 $3,016 $(496)
Percentage of total assets ............................................ 54% 50%
Year Ended
March 31, Increase /
(Decrease)(In millions) 2009 2008
Cash provided by operating activities ..................................... $ 12 $ 338 $(326)
Cash provided by (used in) investing activities ............................. 23 (429) 452
Cash provided by financing activities ..................................... 91 243 (152)
Effect of foreign exchange on cash and cash equivalents ..................... (58) 30 (88)
Net increase in cash and cash equivalents ............................... $ 68 $ 182 $(114)
Changes in Cash Flow
During fiscal year 2009, we generated $12 million of cash from operating activities as compared to generating
$338 million for fiscal year 2008. The decrease in cash provided by operating activities for fiscal year 2009 as
compared to fiscal year 2008 was primarily due to an increase in external development costs, advertising and
marketing costs and personnel-related expenses.
For fiscal year 2009, we generated $891 million of cash proceeds from maturities and sales of short-term
investments and $89 million in proceeds from sales of common stock through our stock-based compensation
plans. Our primary use of cash in non-operating activities consisted of $695 million used to purchase short-term
investments, $115 million in capital expenditures and $58 million used for acquisitions.
Short-term investments and marketable equity securities
Due to our mix of fixed and variable rate securities, our short-term investment portfolio is susceptible to changes
in short-term interest rates. As of March 31, 2009, our short-term investments had gross unrealized gains of $4
million, or 1 percent of the total in short-term investments, and gross unrealized losses of less than $1 million, or
less than 1 percent of the total in short-term investments. From time to time, we may liquidate some or all of our
short-term investments to fund operational needs or other activities, such as capital expenditures, business
acquisitions or stock repurchase programs. Depending on which short-term investments we liquidate to fund
these activities, we could recognize a portion, or all, of the gross unrealized gains or losses.
Marketable equity securities decreased to $365 million as of March 31, 2009, from $729 million as of March 31,
2008. This decrease was due to (1) a $307 million reduction in our unrealized gains and (2) impairment charges
of $30 million and $27 million recognized on our Neowiz and The9 common stock investments, respectively.
Receivables, net
Our gross accounts receivable balances were $333 million and $544 million as of March 31, 2009 and 2008,
respectively. The decrease in our accounts receivable balance was primarily due to lower sales volumes during
53