Electronic Arts 2009 Annual Report Download - page 129
Download and view the complete annual report
Please find page 129 of the 2009 Electronic Arts annual report below. You can navigate through the pages in the report by either clicking on the pages listed below, or by using the keyword search tool below to find specific information within the annual report.-
 1
1 -
2
-
3
-
4
-
5
-
6
-
7
-
8
-
9
-
10
-
11
-
12
-
13
-
14
-
15
-
16
-
17
-
18
-
19
-
20
-
21
-
22
-
23
-
24
-
25
-
26
-
27
-
28
-
29
-
30
-
31
-
32
-
33
-
34
-
35
-
36
-
37
-
38
-
39
-
40
-
41
-
42
-
43
-
44
-
45
-
46
-
47
-
48
-
49
-
50
-
51
-
52
-
53
-
54
-
55
-
56
-
57
-
58
-
59
-
60
-
61
-
62
-
63
-
64
-
65
-
66
-
67
-
68
-
69
-
70
-
71
-
72
-
73
-
74
-
75
-
76
-
77
-
78
-
79
-
80
-
81
-
82
-
83
-
84
-
85
-
86
-
87
-
88
-
89
-
90
-
91
-
92
-
93
-
94
-
95
-
96
-
97
-
98
-
99
-
100
-
101
-
102
-
103
-
104
-
105
-
106
-
107
-
108
-
109
-
110
-
111
-
112
-
113
-
114
-
115
-
116
-
117
-
118
-
 119
119 -
 120
120 -
 121
121 -
 122
122 -
 123
123 -
 124
124 -
 125
125 -
 126
126 -
 127
127 -
 128
128 -
 129
129 -
 130
130 -
 131
131 -
 132
132 -
 133
133 -
 134
134 -
 135
135 -
 136
136 -
 137
137 -
 138
138 -
 139
139 -
140
-
141
-
142
-
143
-
144
-
145
-
146
-
147
-
148
-
149
-
150
-
151
-
152
-
153
-
154
-
155
-
156
-
157
-
158
-
159
-
160
-
161
-
162
-
163
-
164
-
165
-
166
-
167
-
168
-
169
-
170
-
171
-
172
-
173
-
174
-
175
-
176
-
177
-
178
-
179
-
180
-
181
-
182
-
183
-
184
-
185
-
186
-
187
-
188
-
189
-
190
-
191
-
192
-
193
-
194
-
195
-
196
-
197
-
198
-
199
-
200
-
201
-
202
-
203
-
204
-
205
-
206
-
207
-
208
 |
 |

Annual Report
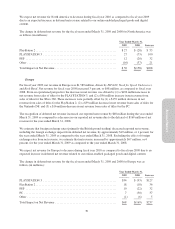
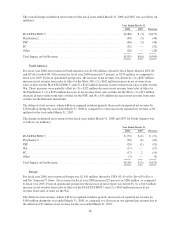
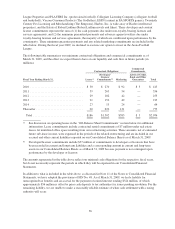
Research and Development
Research and development expenses for fiscal years 2008 and 2007 were as follows (in millions):
March 31,
2008
% of Net
Revenue
March 31,
2007
% of Net
Revenue $ Change % Change
$1,145 31% $1,041 34% $104 10%
As a percentage of net revenue, research and development expenses were adversely impacted by our deferral of
net revenue related to online-enabled packaged goods and digital content during fiscal year 2008.
Research and development expenses increased by $104 million, or 10 percent, in fiscal year 2008 as compared to
fiscal year 2007. The increase was primarily due to (1) an increase of $93 million in additional personnel-related
costs primarily due to an increase in headcount and partially as a result of our acquisition of VGH, (2) higher
external development costs of $32 million to support new releases such as our Union of European Football
Association’s EURO soccer franchise and titles from The Sims franchise, and (3) an increase in depreciation of
$12 million. These increases were partially offset by a $24 million reduction in incentive-based compensation
expense and $6 million reduction in facilities-related expenses.
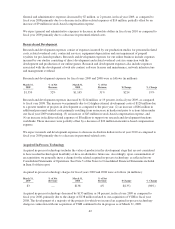
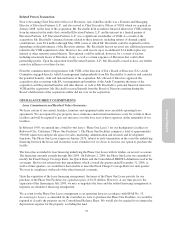
Acquired In-Process Technology
Acquired in-process technology charges for fiscal years 2008 and 2007 were as follows (in millions):
March 31,
2008
% of Net
Revenue
March 31,
2007
% of Net
Revenue $ Change % Change
$138 4% $3 — $135 4500%
In connection with our acquisition of VGH, we incurred acquired in-process technology charges of $138 million
in relation to game software that had not reached technical feasibility at the date of acquisition. The fair values of
VGH’s products under development were determined using the income approach, which discounts expected
future cash flows from the acquired in-process technology to present value. The acquired in-process technology
charge we incurred in fiscal year 2007 resulted from our acquisitions of Mythic and the remaining minority
interest in DICE.
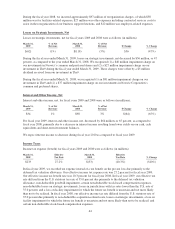
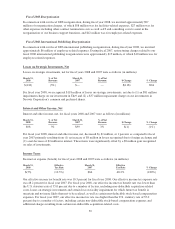
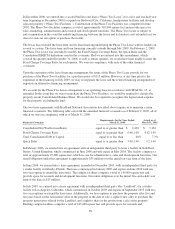
Amortization of Intangibles
Amortization of intangibles for fiscal years 2008 and 2007 was as follows (in millions):
March 31,
2008
% of Net
Revenue
March 31,
2007
% of Net
Revenue $ Change % Change
$34 1% $27 1% $7 26%
For fiscal year 2008, amortization of intangibles resulted from our acquisitions of JAMDAT, VGH and others.
For fiscal year 2007, amortization of intangibles resulted from our acquisitions of JAMDAT, Mythic and others.
Amortization of intangibles increased by $7 million, or 26 percent, in fiscal year 2008 as compared to fiscal year
2007 primarily due to the amortization of intangibles related to our acquisition of VGH.
Restructuring Charges
Restructuring charges for fiscal years 2008 and 2007 were as follows (in millions):
March 31,
2008
% of Net
Revenue
March 31,
2007
% of Net
Revenue $ Change % Change
$103 3% $15 — $88 587%
49