GE 2010 Annual Report Download - page 102
Download and view the complete annual report
Please find page 102 of the 2010 GE annual report below. You can navigate through the pages in the report by either clicking on the pages listed below, or by using the keyword search tool below to find specific information within the annual report.-
 1
1 -
2
-
3
-
4
-
5
-
6
-
7
-
8
-
9
-
10
-
11
-
12
-
13
-
14
-
15
-
16
-
17
-
18
-
19
-
20
-
21
-
22
-
23
-
24
-
25
-
26
-
27
-
28
-
29
-
30
-
31
-
32
-
33
-
34
-
35
-
36
-
37
-
38
-
39
-
40
-
41
-
42
-
43
-
44
-
45
-
46
-
47
-
48
-
49
-
50
-
51
-
52
-
53
-
54
-
55
-
56
-
57
-
58
-
59
-
60
-
61
-
62
-
63
-
64
-
65
-
66
-
67
-
68
-
69
-
70
-
71
-
72
-
73
-
74
-
75
-
76
-
77
-
78
-
79
-
80
-
81
-
82
-
83
-
84
-
85
-
86
-
87
-
88
-
89
-
90
-
91
-
 92
92 -
 93
93 -
 94
94 -
 95
95 -
 96
96 -
 97
97 -
 98
98 -
 99
99 -
 100
100 -
 101
101 -
 102
102 -
 103
103 -
 104
104 -
 105
105 -
 106
106 -
 107
107 -
 108
108 -
 109
109 -
 110
110 -
 111
111 -
 112
112 -
113
-
114
-
115
-
116
-
117
-
118
-
119
-
120
-
121
-
122
-
123
-
124
-
125
-
126
-
127
-
128
-
129
-
130
-
131
-
132
-
133
-
134
-
135
-
136
-
137
-
138
-
139
-
140
 |
 |

100 GE 2010 ANNUAL REPORT
Plan fiduciaries set investment policies and strategies for the trust
and oversee its investment allocation, which includes selecting
investment managers and setting long-term strategic targets. The
primary long-term strategic investment objective is balancing
investment risk and return. Target allocation percentages are
established at an asset class level by plan fiduciaries. Target alloca-
tion ranges are guidelines, not limitations, and occasionally plan
fiduciaries will approve allocations above or below a target range.
Trust assets invested in short-term securities must generally
be invested in securities rated A1/P1 or better, except for 15% of
such securities that may be rated A2/P2 and other short-term
securities as may be approved by the plan fiduciaries. According
to statute, the aggregate holdings of all qualifying employer
securities (e.g., GE common stock) and qualifying employer real
property may not exceed 10% of the fair value of trust assets at
the time of purchase. GE securities represented 4.5% and 3.7%
of trust assets at year-end 2010 and 2009, respectively.
Retiree life plan assets were $1,125 million and $1,138 million
at December 31, 2010 and 2009, respectively. Equity and debt
securities amounting to $942 million and $959 million represented
approximately 78% and 80% of total investments at December 31,
2010 and 2009, respectively. The plans’ investments were classi-
fied as 39% Level 1, 39% Level 2 and 22% Level 3 at December 31,
2010. The plans’ investments were classified as 42% Level 1,
37% Level 2 and 21% Level 3 at December 31, 2009. The changes
in Level 3 investments were insignificant for the years ended
December 31, 2010 and 2009.
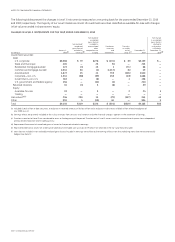
RETIREE BENEFIT ASSET (LIABILITY)
December 31 (In millions) 2010 2009
Funded status
(a)
$(10,885) $(11,637)
Liability recorded in the Statement
of Financial Position
Retiree health plans
Due within one year $ (644) $ (691)
Due after one year (8,922) (9,790)
Retiree life plans (1,319) (1,156)
Net liability recognized $(10,885) $(11,637)
Amounts recorded in shareowners’
equity (unamortized)
Prior service cost $ 3,523 $ 4,154
Net actuarial loss (gain) (671) 272
Total $ 2,852 $ 4,426
(a) Fair value of assets less APBO, as shown in the preceding tables.
In 2011, we estimate that we will amortize $630 million of prior
service cost and $110 million of net actuarial gain from shareown-
ers’ equity into retiree benefit plans cost. Comparable amortized
amounts in 2010 were $631 million of prior service cost and
$22 million of net actuarial gains.
ESTIMATED FUTURE BENEFIT PAYMENTS
2016 –
(In millions) 2011 2012 2013 2014 2015 2020
Gross $845 $840 $840 $840 $845 $4,255
Expected Medicare
Part D subsidy 5 5 5 5 5 20
Net $840 $835 $835 $835 $840 $4,235
Changes in the accumulated postretirement benefit obligation
for retiree benefit plans follow.
ACCUMULATED POSTRETIREMENT BENEFIT OBLIGATION (APBO)
(In millions) 2010 2009
Balance at January 1 $12,775 $11,949
Service cost for benefits earned 241 442
Interest cost on benefit obligations 699 709
Participant contributions 55 50
Plan amendments — (37)
Actuarial loss (gain)
(a)(b) (942) 504
Benefits paid
(c) (818) (842)
Balance at December 31
(d) $12,010 $12,775
(a) For 2010, included the effects of healthcare reform provisions on our Medicare-
approved prescription drug plan.
(b) For 2009, included a $152 million reduction in APBO as a result of our agreement
with Comcast Corporation to transfer the NBCU business to a newly formed entity
in which we will own a 49% interest.
(c) Net of Medicare Part D subsidy of $72 million and $83 million in 2010 and 2009,
respectively.
(d) The APBO for the retiree health plans was $9,566 million and $10,481 million at
year-end 2010 and 2009, respectively.
A one percentage point change in the assumed healthcare cost
trend rate would have the following effects.
(In millions) 1% increase 1% decrease
APBO at December 31, 2010 $1,012 $(858)
Service and interest costs in 2010 91 (76)
PLAN ASSETS
The fair value of the classes of retiree benefit plans’ investments
is presented below. The inputs and valuation techniques used to
measure the fair value of assets are consistently applied and
described in Note 1.
FAIR VALUE OF PLAN ASSETS
(In millions) 2010 2009
Balance at January 1 $1,138 $1,175
Actual gain on plan assets 139 111
Employer contributions 611 644
Participant contributions 55 50
Benefits paid
(a) (818) (842)
Balance at December 31 $1,125 $1,138
(a) Net of Medicare Part D subsidy.
ASSET ALLOCATION
2010 2010
Target Actual
December 31 allocation allocation
Equity securities 37–77 % (a) 44
Debt securities (including cash equivalents) 11–41 34
Private equities 3–13 13
Real estate 2–12 5
Other 0–10 4
(a) Target allocations were 19–39% for U.S. equity securities and 18–38% for non-U.S.
equity securities.
(b) Actual allocations were 25% for U.S. equity securities and 19% for non-U.S.
equity securities.
% (b)