GE 2010 Annual Report Download - page 51
Download and view the complete annual report
Please find page 51 of the 2010 GE annual report below. You can navigate through the pages in the report by either clicking on the pages listed below, or by using the keyword search tool below to find specific information within the annual report.-
 1
1 -
2
-
3
-
4
-
5
-
6
-
7
-
8
-
9
-
10
-
11
-
12
-
13
-
14
-
15
-
16
-
17
-
18
-
19
-
20
-
21
-
22
-
23
-
24
-
25
-
26
-
27
-
28
-
29
-
30
-
31
-
32
-
33
-
34
-
35
-
36
-
37
-
38
-
39
-
40
-
 41
41 -
 42
42 -
 43
43 -
 44
44 -
 45
45 -
 46
46 -
 47
47 -
 48
48 -
 49
49 -
 50
50 -
 51
51 -
 52
52 -
 53
53 -
 54
54 -
 55
55 -
 56
56 -
 57
57 -
 58
58 -
 59
59 -
 60
60 -
 61
61 -
62
-
63
-
64
-
65
-
66
-
67
-
68
-
69
-
70
-
71
-
72
-
73
-
74
-
75
-
76
-
77
-
78
-
79
-
80
-
81
-
82
-
83
-
84
-
85
-
86
-
87
-
88
-
89
-
90
-
91
-
92
-
93
-
94
-
95
-
96
-
97
-
98
-
99
-
100
-
101
-
102
-
103
-
104
-
105
-
106
-
107
-
108
-
109
-
110
-
111
-
112
-
113
-
114
-
115
-
116
-
117
-
118
-
119
-
120
-
121
-
122
-
123
-
124
-
125
-
126
-
127
-
128
-
129
-
130
-
131
-
132
-
133
-
134
-
135
-
136
-
137
-
138
-
139
-
140
 |
 |

management’s discussion and analsis
GE 2010 ANNUAL REPORT 49
On January 1, 2010, we adopted ASU 2009-16 & 17, resulting in
the consolidation of $40.2 billion of net financing receivables at
January 1, 2010. We have provided comparisons of our financing
receivables portfolio at December 31, 2010 to January 1, 2010,
as we believe that it provides a more meaningful comparison of
our portfolio quality following the adoption of ASU 2009-16 & 17.
The portfolio of financing receivables, before allowance for
losses, was $327.3 billion at December 31, 2010, and $376.7 billion
at January 1, 2010. Financing receivables, before allowance for
losses, decreased $49.4 billion from January 1, 2010, primarily as a
result of collections exceeding originations ($26.3 billion) (which
includes sales), write-offs ($10.1 billion), the stronger U.S. dollar
($2.1 billion) and dispositions ($1.2 billion), partially offset by acqui-
sitions ($2.8 billion).
Related nonearning receivables totaled $11.6 billion (3.5% of
outstanding receivables) at December 31, 2010, compared with
$14.2 billion (3.8% of outstanding receivables) at January 1, 2010.
Nonearning receivables decreased from January 1, 2010, primar-
ily due to improvements in our entry rates in Consumer and
CLL—AMERICAS. Nonearning receivables of $2.6 billion repre-
sented 22.2% of total nonearning receivables at December 31,
2010. The ratio of allowance for losses as a percent of nonearn-
ing receivables increased from 36.2% at January 1, 2010, to
50.1% at December 31, 2010, reflecting an overall decrease in
improved performance in Commercial, offset by increased Real
Estate delinquencies driven by the continued challenging envi-
ronment in the commercial real estate markets.
The allowance for losses at December 31, 2010, totaled $8.1 bil-
lion compared with $9.6 billion at January 1, 2010, representing
our best estimate of probable losses inherent in the portfolio.
Allowance for losses decreased $1.5 billion from January 1, 2010,
primarily because provisions were lower than write-offs, net of
recoveries by $1.3 billion, which is attributable to a reduction in
the overall financing receivables balance and an improvement
in the overall credit environment. The allowance for losses as a
percent of total financing receivables increased from 2.3% at
December 31, 2009 to 2.5% at December 31, 2010, primarily due
to the adoption of ASU 2009-16 & 17 on January 1, 2010. Further
information surrounding the allowance for losses related to each
of our portfolios is detailed below.
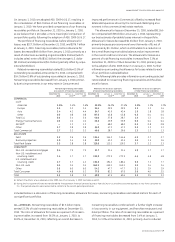
The following table provides information surrounding selected
ratios related to nonearning financing receivables and the allow-
ance for losses.
nonearning receivables combined with a further slight increase
in loss severity in our equipment, and franchise restaurant and
hotel portfolios. The ratio of nonearning receivables as a percent
of financing receivables decreased from 3.4% at January 1,
2010, to 3.0% at December 31, 2010, primarily due to reduced
Nonearning financing receivables Allowance for losses as a percent Allowance for losses as a percent
as a percent of financing receivables of nonearning financing receivables of total financing receivables
December 31, January 1, December 31, December 31, January 1, December 31, December 31, January 1, December 31,
2010 2010 (a) 2009 2010 2010 (a) 2009 2010 2010 (a) 2009
COMMERCIAL
CLL(b)
Americas 3.0% 3.4% 3.6% 50.1% 36.2% 37.4% 1.5% 1.2% 1.3%
Europe 3.3 3.3 3.5 34.6 39.9 39.9 1.1 1.3 1.4
Asia 3.4 4.2 4.4 54.7 41.9 42.4 1.9 1.8 1.8
Other 0.3 0.8 0.8 87.5 45.8 45.8 0.3 0.4 0.4
Total CLL 3.0 3.4 3.6 46.0 37.8 38.7 1.4 1.3 1.4
Energy Financial Services 0.9 1.0 1.0 35.5 35.9 35.9 0.3 0.4 0.4
GECAS(b) — 1.2 1.2 — 68.0 68.0 0.2 0.8 0.8
Other 5.7 2.8 2.8 56.9 47.2 47.2 3.2 1.3 1.3
Total Commercial 2.7 3.2 3.3 46.6 38.7 39.6 1.3 1.2 1.3
REAL ESTATE
Debt 3.2 2.6 2.6 134.4 144.3 144.6 4.3 3.7 3.7
Business properties 3.9 3.4 3.8 50.8 43.2 43.5 2.0 1.5 1.6
Total Real Estate 3.3 2.8 2.8 110.5 113.1 119.3 3.7 3.2 3.3
CONSUMER(b)
Non-U.S. residential mortgages 8.4 7.9 7.9 21.7 21.4 21.4 1.8 1.7 1.7
Non-U.S. installment and
revolving credit 1.4 1.7 1.7 325.9 272.9 272.9 4.6 4.8 4.8
U.S. installment and
revolving credit 2.7 3.7 4.2 194.3 194.2 186.4 5.3 7.2 7.7
Non-U.S. auto 0.5 0.5 0.5 362.5 459.1 459.1 2.0 2.4 2.4
Other 5.8 6.0 6.0 54.2 47.7 47.7 3.1 2.9 2.9
Total Consumer 4.6 4.8 5.2 77.9 82.2 67.0 3.6 4.0 3.5
Total 3.5 3.8 3.9 69.8 67.5 60.4 2.5 2.5 2.3
(a) Reflects the effects of our adoption of ASU 2009-16 & 17 on January 1, 2010. See Notes 6 and 23.
(b) During the first quarter of 2010, we transferred the Transportation Financial Services business from GECAS to CLL and the Consumer business in Italy from Consumer to
CLL. Prior-period amounts were reclassified to conform to the current-period presentation.
Included below is a discussion of financing receivables, allowance for losses, nonearning receivables and related metrics for each of
our significant portfolios.