GE 2010 Annual Report Download - page 52
Download and view the complete annual report
Please find page 52 of the 2010 GE annual report below. You can navigate through the pages in the report by either clicking on the pages listed below, or by using the keyword search tool below to find specific information within the annual report.-
 1
1 -
2
-
3
-
4
-
5
-
6
-
7
-
8
-
9
-
10
-
11
-
12
-
13
-
14
-
15
-
16
-
17
-
18
-
19
-
20
-
21
-
22
-
23
-
24
-
25
-
26
-
27
-
28
-
29
-
30
-
31
-
32
-
33
-
34
-
35
-
36
-
37
-
38
-
39
-
40
-
41
-
 42
42 -
 43
43 -
 44
44 -
 45
45 -
 46
46 -
 47
47 -
 48
48 -
 49
49 -
 50
50 -
 51
51 -
 52
52 -
 53
53 -
 54
54 -
 55
55 -
 56
56 -
 57
57 -
 58
58 -
 59
59 -
 60
60 -
 61
61 -
 62
62 -
63
-
64
-
65
-
66
-
67
-
68
-
69
-
70
-
71
-
72
-
73
-
74
-
75
-
76
-
77
-
78
-
79
-
80
-
81
-
82
-
83
-
84
-
85
-
86
-
87
-
88
-
89
-
90
-
91
-
92
-
93
-
94
-
95
-
96
-
97
-
98
-
99
-
100
-
101
-
102
-
103
-
104
-
105
-
106
-
107
-
108
-
109
-
110
-
111
-
112
-
113
-
114
-
115
-
116
-
117
-
118
-
119
-
120
-
121
-
122
-
123
-
124
-
125
-
126
-
127
-
128
-
129
-
130
-
131
-
132
-
133
-
134
-
135
-
136
-
137
-
138
-
139
-
140
 |
 |
management’s discussion and analsis
50 GE 2010 ANNUAL REPORT
nonearning exposures in our corporate lending, corporate air-
craft, and industrial materials portfolios, which more than offset
deterioration in our healthcare and franchise restaurant and
hotel portfolios. Collateral supporting these nonearning financ-
ing receivables primarily includes corporate aircraft and assets
in the restaurant and hospitality, trucking, and forestry indus-
tries, and for our leveraged finance business, equity of the
underlying businesses.
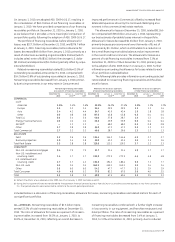
CLL—EUROPE. Nonearning receivables of $1.2 billion represented
10.7% of total nonearning receivables at December 31, 2010.
The ratio of allowance for losses as a percent of nonearning
receivables decreased from 39.9% at January 1, 2010, to 34.6%
at December 31, 2010, as a greater proportion of nonearning
receivables was attributable to the Interbanca S.p.A. portfolio,
which was acquired in 2009. The loans acquired with Interbanca
S.p.A. were recorded at fair value, which incorporates an esti-
mate at the acquisition date of credit losses over their remaining
life. Accordingly, these loans generally have a lower ratio of
allowance for losses as a percent of nonearning receivables
compared to the remaining portfolio. Excluding the nonearning
loans attributable to the 2009 acquisition of Interbanca S.p.A.,
the ratio of allowance for losses as a percent of nonearning
receivables decreased slightly from 67.2% at January 1, 2010,
to 65.7% at December 31, 2010, due to the increase of highly
collateralized nonearning receivables in our senior secured
lending portfolio, partially offset by a reduction in nonearning
receivables in our senior secured lending and equipment finance
portfolios due to restructuring, sale, or write-off. The ratio of
nonearning receivables as a percent of financing receivables
remained consistent at 3.3% at December 31, 2010, due to an
increase in nonearning receivables in the Interbanca S.p.A.
portfolio offset by the decrease in nonearning receivables
across our senior secured lending, equipment finance and asset-
based lending portfolios, primarily for the reasons previously
mentioned. Collateral supporting these secured nonearning
financing receivables are primarily equity of the underlying
businesses for our senior secured lending business and equip-
ment and trade receivables for our equipment finance and
asset-based lending portfolios, respectively.
CLL—ASIA. Nonearning receivables of $0.4 billion represented
3.5% of total nonearning receivables at December 31, 2010. The
ratio of allowance for losses as a percent of nonearning receiv-
ables increased from 41.9% at January 1, 2010, to 54.7% at
December 31, 2010, primarily as a result of restructuring, sale or
write-off of nonearning receivables in our asset-based financing
businesses in Japan, which is highly collateralized. The ratio of
nonearning receivables as a percent of financing receivables
decreased from 4.2% at January 1, 2010, to 3.4% at December 31,
2010, primarily due to the decline in nonearning receivables
related to our asset-based financing businesses in Japan, par-
tially offset by a lower financing receivables balance. Collateral
supporting these nonearning financing receivables is primarily
commercial real estate, manufacturing equipment, corporate
aircraft, and assets in the auto industry.
REAL ESTATE—DEBT. Nonearning receivables of $1.0 billion repre-
sented 8.3% of total nonearning receivables at December 31,
2010. The increase in nonearning receivables from January 1, 2010,
was driven primarily by increased delinquencies in the U.S. office
portfolio and the European hotel and retail portfolios, partially
offset by foreclosures and discounted payoffs primarily related
to U.S. multi-family loans. The ratio of allowance for losses as a
percent of nonearning receivables decreased from 144.3% to
134.4% reflecting write-offs driven by settlements and payoffs
from impaired loan borrowers. Since our approach identifies
loans as impaired even when the loan is currently paying in
accordance with contractual terms, increases in nonearning
receivables do not necessarily require proportionate increases
in reserves upon migration to nonearning status as specific
reserves have often been established on the loans prior to their
migration to nonearning status. The ratio of allowance for losses
as a percent of total financing receivables increased from 3.7%
at January 1, 2010, to 4.3% at December 31, 2010, driven pri-
marily by continued rental rate deterioration in the U.S. markets,
which resulted in an increase in specific credit loss provisions.
The Real Estate financing receivables portfolio is collateralized
by income-producing or owner-occupied commercial properties
across a variety of asset classes and markets. At December 31,
2010, total Real Estate financing receivables of $40.2 billion were
primarily collateralized by owner-occupied properties ($10.0 bil-
lion), office buildings ($9.4 billion), apartment buildings
($6.2 billion) and hotel properties ($4.4 billion). In 2010, commercial
real estate markets have continued to be under pressure, with
limited market liquidity and challenging economic conditions. We
have and continue to maintain an intense focus on operations and
risk management. Loan loss reserves related to our Real Estate—
Debt financing receivables are particularly sensitive to declines in
underlying property values. Assuming global property values
decline an incremental 1% or 5%, and that decline occurs evenly
across geographies and asset classes, we estimate incremental
loan loss reserves would be required of approximately $0.1 billion
and $0.4 billion, respectively. Estimating the impact of global
property values on loss performance across our portfolio
depends on a number of factors, including macroeconomic condi-
tions, property level operating performance, local market
dynamics and individual borrower behavior. As a result, any sensi-
tivity analyses or attempts to forecast potential losses carry a high
degree of imprecision and are subject to change. At December 31,
2010, we had 116 foreclosed commercial real estate properties
which had a value of approximately $0.6 billion.
CONSUMER—NON-U.S. RESIDENTIAL MORTGAGES. Nonearning
receivables of $3.8 billion represented 33.0% of total non-
earning receivables at December 31, 2010. The ratio of
allowance for losses as a percent of nonearning receivables
increased slightly from 21.4% at January 1, 2010, to 21.7%
at December 31, 2010. In 2010, our nonearning receivables
decreased primarily due to continued collection and loss mitiga-
tion efforts and signs of stabilization in the U.K. housing market.
Our non-U.S. mortgage portfolio has a loan-to-value ratio of
approximately 75% at origination and the vast majority are first
lien positions. Our U.K. and France portfolios, which comprise a
majority of our total mortgage portfolio, have reindexed