GE 2010 Annual Report Download - page 54
Download and view the complete annual report
Please find page 54 of the 2010 GE annual report below. You can navigate through the pages in the report by either clicking on the pages listed below, or by using the keyword search tool below to find specific information within the annual report.-
 1
1 -
2
-
3
-
4
-
5
-
6
-
7
-
8
-
9
-
10
-
11
-
12
-
13
-
14
-
15
-
16
-
17
-
18
-
19
-
20
-
21
-
22
-
23
-
24
-
25
-
26
-
27
-
28
-
29
-
30
-
31
-
32
-
33
-
34
-
35
-
36
-
37
-
38
-
39
-
40
-
41
-
42
-
43
-
 44
44 -
 45
45 -
 46
46 -
 47
47 -
 48
48 -
 49
49 -
 50
50 -
 51
51 -
 52
52 -
 53
53 -
 54
54 -
 55
55 -
 56
56 -
 57
57 -
 58
58 -
 59
59 -
 60
60 -
 61
61 -
 62
62 -
 63
63 -
 64
64 -
65
-
66
-
67
-
68
-
69
-
70
-
71
-
72
-
73
-
74
-
75
-
76
-
77
-
78
-
79
-
80
-
81
-
82
-
83
-
84
-
85
-
86
-
87
-
88
-
89
-
90
-
91
-
92
-
93
-
94
-
95
-
96
-
97
-
98
-
99
-
100
-
101
-
102
-
103
-
104
-
105
-
106
-
107
-
108
-
109
-
110
-
111
-
112
-
113
-
114
-
115
-
116
-
117
-
118
-
119
-
120
-
121
-
122
-
123
-
124
-
125
-
126
-
127
-
128
-
129
-
130
-
131
-
132
-
133
-
134
-
135
-
136
-
137
-
138
-
139
-
140
 |
 |

management’s discussion and analsis
52 GE 2010 ANNUAL REPORT
Impaired loans consolidated as a result of our adoption of
ASU 2009-16 & 17 primarily related to our Consumer business.
Impaired loans increased by $4.8 billion from January 1, 2010, to
December 31, 2010, primarily relating to increases at Real Estate.
We regularly review our Real Estate loans for impairment using
both quantitative and qualitative factors, such as debt service
coverage and loan-to-value ratios. See Note 1. We classify Real
Estate loans as impaired when the most recent valuation
reflects a projected loan-to-value ratio at maturity in excess of
100%, even if the loan is currently paying in accordance with
contractual terms. The increase in Real Estate impaired loans
reflects deterioration in commercial real estate values, particu-
larly in Japan and the U.S., as well as an increase in troubled
debt restructurings (TDRs). Real Estate specific reserves have
not increased proportionately to the increase in impaired loans,
primarily due to an increase in TDRs that are expected to be
fully recoverable based on the value of the underlying collateral
and are performing in accordance with their modified terms.
Of our $9.8 billion impaired loans at Real Estate at December 31,
2010, $8.1 billion are currently paying in accordance with the
contractual terms of the loan and are typically loans where
the borrower has adequate debt service coverage to meet
contractual interest obligations. Impaired loans at CLL primarily
represent senior secured lending positions.
Our impaired loan balance at December 31, 2010 and
December 31, 2009, classified by the method used to measure
impairment was as follows.
At
December 31, December 31,
(In millions) 2010 2009
METHOD USED TO MEASURE IMPAIRMENT
Discounted cash flow $ 7,650 $ 6,971
Collateral value 10,541 5,866
Total $18,191 $12,837
See Note 1 for further information on collateral dependent loans
and our valuation process.
Our loss mitigation strategy is intended to minimize economic
loss and, at times, can result in rate reductions, principal forgive-
ness, extensions, forbearance or other actions, which may cause
the related loan to be classified as a TDR, and also as impaired.
Changes to Real Estate’s loans primarily include maturity exten-
sions, principal payment acceleration, changes to collateral terms
and cash sweeps, which are in addition to, or sometimes in lieu of,
fees and rate increases. The determination of whether these
changes to the terms and conditions of our commercial loans
meet the TDR criteria includes our consideration of all relevant
facts and circumstances. At December 31, 2010, TDRs included in
impaired loans were $10.1 billion, primarily relating to Real Estate
($4.9 billion), CLL ($2.9 billion) and Consumer ($2.3 billion). TDRs
consolidated as a result of our adoption of ASU 2009-16 & 17
primarily related to our Consumer business ($0.4 billion).
We utilize certain short-term loan modification programs for
borrowers experiencing temporary financial difficulties in our
Consumer loan portfolio. These loan modification programs are
primarily concentrated in our U.S. credit card and non-U.S. resi-
dential mortgage portfolios. We sold our U.S. residential
mortgage business in 2007 and as such, do not participate in the
U.S. government-sponsored mortgage modification programs.
During 2010, we provided short-term modifications of approxi-
mately $2.7 billion of consumer loans for borrowers experiencing
financial difficulties. This included approximately $1.2 billion of
credit card loans in the U.S. and approximately $1.5 billion of other
consumer loans, primarily non-U.S. residential mortgages, credit
cards and personal loans, which were not classified as TDRs. For
these modified loans, we provided short-term (12 months or less)
interest rate reductions and payment deferrals, which were not
part of the terms of the original contract. We expect borrowers
whose loans have been modified under these short-term pro-
grams to continue to be able to meet their contractual obligations
upon the conclusion of the short-term modification. Our experi-
ence indicates that a substantial majority of loan modifications
during 2010 have been successful, as approximately $2.2 billion
are performing in accordance with the revised contractual terms.
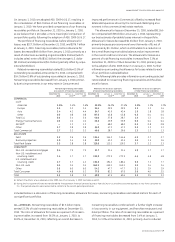
Delinquencies
Additional information on delinquency rates at each of our major
portfolios follows:
December 31, December 31,
2010 2009
CLL 2.1% 3.1%
Consumer 8.1 9.4
Real Estate 4.4 4.3
Delinquency rates on commercial loans and leases decreased
from December 31, 2009 to December 31, 2010, as a result of
improvements in the global economic and credit environment.
We expect the global environment to show further signs of
stabilization in 2011; however, the credit environment continues
to be uncertain and may impact future levels of commercial
delinquencies and provisions for losses on financing receivables.
Delinquency rates on consumer financing receivables
decreased from December 31, 2009 to December 31, 2010, pri-
marily due to improved collections and lower delinquency entry
rates in our U.S. markets. We expect the global environment,
along with U.S. unemployment levels, to further show signs
of stabilization in 2011; however, the uncertain economic envi-
ronment may result in higher provisions for loan losses. At
December 31, 2010, approximately 41% of our U.S. portfolio,
which consisted of credit cards, installment and revolving loans,
were receivable from subprime borrowers. We had no U.S. sub-
prime residential mortgage loans at December 31, 2010.
See Notes 6 and 23 for additional information.
Delinquency rates on Real Estate loans and leases increased
from December 31, 2009 to December 31, 2010, primarily reflecting
continued challenging real estate market fundamentals, including
reduced occupancy rates and rentals and the effects of real estate
market liquidity, which despite stabilization in certain markets,
continues to remain limited in many others. Slow economic recovery
could result in a continuation of elevated delinquency levels and
provisions for losses on financing receivables.