GE 2010 Annual Report Download - page 106
Download and view the complete annual report
Please find page 106 of the 2010 GE annual report below. You can navigate through the pages in the report by either clicking on the pages listed below, or by using the keyword search tool below to find specific information within the annual report.-
 1
1 -
2
-
3
-
4
-
5
-
6
-
7
-
8
-
9
-
10
-
11
-
12
-
13
-
14
-
15
-
16
-
17
-
18
-
19
-
20
-
21
-
22
-
23
-
24
-
25
-
26
-
27
-
28
-
29
-
30
-
31
-
32
-
33
-
34
-
35
-
36
-
37
-
38
-
39
-
40
-
41
-
42
-
43
-
44
-
45
-
46
-
47
-
48
-
49
-
50
-
51
-
52
-
53
-
54
-
55
-
56
-
57
-
58
-
59
-
60
-
61
-
62
-
63
-
64
-
65
-
66
-
67
-
68
-
69
-
70
-
71
-
72
-
73
-
74
-
75
-
76
-
77
-
78
-
79
-
80
-
81
-
82
-
83
-
84
-
85
-
86
-
87
-
88
-
89
-
90
-
91
-
92
-
93
-
94
-
95
-
 96
96 -
 97
97 -
 98
98 -
 99
99 -
 100
100 -
 101
101 -
 102
102 -
 103
103 -
 104
104 -
 105
105 -
 106
106 -
 107
107 -
 108
108 -
 109
109 -
 110
110 -
 111
111 -
 112
112 -
 113
113 -
 114
114 -
 115
115 -
 116
116 -
117
-
118
-
119
-
120
-
121
-
122
-
123
-
124
-
125
-
126
-
127
-
128
-
129
-
130
-
131
-
132
-
133
-
134
-
135
-
136
-
137
-
138
-
139
-
140
 |
 |

104 GE 2010 ANNUAL REPORT
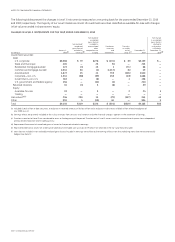
Note 15.
Shareowners’ Equity
(In millions) 2010 2009 2008
PREFERRED STOCK ISSUED
(a) (b) (c) $ — $ — $ —
COMMON STOCK ISSUED
(a) (b) $ 702 $ 702 $ 702
ACCUMULATED OTHER COMPREHENSIVE INCOME
Balance at January 1
(d) $ (15,530) $ (21,853) $ 8,324
Investment securities—net of deferred taxes of $72, $1,001 and $(2,528)
(e) (43) 2,678 (3,813)
Currency translation adjustments—net of deferred taxes of $3,742, $(611) and $4,082 (3,879) 4,174 (10,890)
Cash flow hedges—net of deferred taxes of $(515), $933 and $(2,307) (603) 986 (4,907)
Benefit plans—net of deferred taxes of $572, $(5) and $(7,379)
(f) 1,079 (1,804) (13,288)
Reclassification adjustments
Investment securities—net of deferred taxes of $32, $494 and $734 59 (19) 595
Currency translation adjustments 5 (39) (117)
Cash flow hedges—net of deferred taxes of $706, $428 and $620 1,057 612 2,243
Balance at December 31 $ (17,855) $ (15,265) $ (21,853)
OTHER CAPITAL
Balance at January 1 $ 37,729 $ 40,390 $ 26,100
Common stock issuance
(b) — — 11,972
Preferred stock and warrant issuance
(b) — — 2,965
Gains (losses) on treasury stock dispositions and other
(b) (839) (2,661) (647)
Balance at December 31 $ 36,890 $ 37,729 $ 40,390
RETAINED EARNINGS
Balance at January 1
(g) $124,655 $122,185 $117,362
Net earnings attributable to the Company 11,644 11,025 17,410
Dividends (b) (h) (5,212) (6,785) (12,649)
Other
(b) (i) 50 (62) —
Balance at December 31 $131,137 $126,363 $122,123
COMMON STOCK HELD IN TREASURY
Balance at January 1 $ (32,238) $ (36,697) $ (36,896)
Purchases (b) (1,890) (214) (3,508)
Dispositions (b) 2,190 4,673 3,707
Balance at December 31 $ (31,938) $ (32,238) $ (36,697)
TOTAL EQUITY
GE shareowners’ equity balance at December 31 $118,936 $117,291 $104,665
Noncontrolling interests balance at December 31 5,262 7,845 8,947
Total equity balance at December 31 $124,198 $125,136 $113,612
(a) Additions resulting from issuances in 2008 were inconsequential for preferred stock and $33 million for common stock.
(b) Total dividends and other transactions with shareowners, inclusive of additions to par value discussed in note (a), decreased equity by $(5,701) million in 2010, decreased equity
by $(5,049) million in 2009 and increased equity by $1,873 million in 2008.
(c) GE has 50 million authorized shares of preferred stock ($1.00 par value) and has issued 30 thousand shares as of December 31, 2010.
(d) The 2010 opening balance was adjusted as of January 1, 2010, for the cumulative effect of changes in accounting principles of $265 million related to the adoption of
ASU 2009-16 & 17.
(e) Includes adjustments of $1,171 million as of December 31, 2010 to deferred acquisition costs, present value of future profits, and investment contracts, insurance liabilities and
insurance annuity benefits in our run-off insurance operation to reflect the effects that would have been recognized had the related unrealized investment securities holding
gains and losses actually been realized in accordance with ASC 320-10-S99-2.
(f) For 2010, included $(3) million of prior service costs for plan amendments, $513 million of amortization of prior service costs, $(487) million of gains (losses) arising during the
year and $1,056 million of amortization of gains (losses)—net of deferred taxes of $1 million, $346 million, $(261) million and $486 million, respectively. For 2009, included
$(9) million of prior service costs for plan amendments, $814 million of amortization of prior service costs, $(2,793) million of gains (losses) arising during the year and
$184 million of amortization of gains (losses)—net of deferred taxes of $(10) million, $434 million, $(528) million and $99 million, respectively. For 2008, included $(43) million of
prior service costs for plan amendments, $534 million of amortization of prior service costs, $(13,980) million of gains (losses) arising during the year and $201 million of
amortization of gains (losses)—net of deferred taxes of $(24) million, $441 million, $(7,893) million and $97 million, respectively.
(g) The 2010 opening balance was adjusted as of January 1, 2010, for the cumulative effect of changes in accounting principles of $1,708 million related to the adoption of
ASU 2009-16 & 17. The 2009 opening balance was adjusted as of April 1, 2009, for the cumulative effect of changes in accounting principles of $62 million related to adopting
amendments on impairment guidance in ASC 320, Investments—Debt and Equity Securities. The cumulative effect of adopting ASC 825, Financial Instruments, at January 1,
2008, was insignificant.
(h) Included $300 million, $300 million and $75 million of dividends on preferred stock in 2010, 2009 and 2008, respectively.
(i) Included the effects of accretion of redeemable securities to their redemption value of $38 million and $(62) million in 2010 and 2009, respectively.