GE 2010 Annual Report Download - page 119
Download and view the complete annual report
Please find page 119 of the 2010 GE annual report below. You can navigate through the pages in the report by either clicking on the pages listed below, or by using the keyword search tool below to find specific information within the annual report.-
 1
1 -
2
-
3
-
4
-
5
-
6
-
7
-
8
-
9
-
10
-
11
-
12
-
13
-
14
-
15
-
16
-
17
-
18
-
19
-
20
-
21
-
22
-
23
-
24
-
25
-
26
-
27
-
28
-
29
-
30
-
31
-
32
-
33
-
34
-
35
-
36
-
37
-
38
-
39
-
40
-
41
-
42
-
43
-
44
-
45
-
46
-
47
-
48
-
49
-
50
-
51
-
52
-
53
-
54
-
55
-
56
-
57
-
58
-
59
-
60
-
61
-
62
-
63
-
64
-
65
-
66
-
67
-
68
-
69
-
70
-
71
-
72
-
73
-
74
-
75
-
76
-
77
-
78
-
79
-
80
-
81
-
82
-
83
-
84
-
85
-
86
-
87
-
88
-
89
-
90
-
91
-
92
-
93
-
94
-
95
-
96
-
97
-
98
-
99
-
100
-
101
-
102
-
103
-
104
-
105
-
106
-
107
-
108
-
 109
109 -
 110
110 -
 111
111 -
 112
112 -
 113
113 -
 114
114 -
 115
115 -
 116
116 -
 117
117 -
 118
118 -
 119
119 -
 120
120 -
 121
121 -
 122
122 -
 123
123 -
 124
124 -
 125
125 -
 126
126 -
 127
127 -
 128
128 -
 129
129 -
130
-
131
-
132
-
133
-
134
-
135
-
136
-
137
-
138
-
139
-
140
 |
 |

GE 2010 ANNUAL REPORT 117
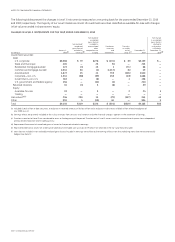
NONACCRUAL FINANCING RECEIVABLES
The following table provides further information about Commercial financing receivables that are classified as nonaccrual. Of our
$5,463 million of nonaccrual financing receivables at December 31, 2010, $1,016 million are currently paying in accordance with their
contractual terms.
COMMERCIAL (a)
Nonaccrual financing receivables at Nonearning financing receivables at
December 31, January 1, December 31, December 31, January 1, December 31,
(Dollars in millions) 2010 2010
(b) 2009 2010 2010 (b) 2009
CLL
Americas $3,206 $3,776 $3,484 $2,571 $3,437 $3,155
Europe 1,415 1,441 1,441 1,241 1,441 1,441
Asia 616 559 576 406 559 576
Other 9 24 24 8 24 24
Total CLL 5,246 5,800 5,525 4,226 5,461 5,196
Energy Financial Services 78 183 183 62 78 78
GECAS — 153 153 — 153 153
Other 139 95 95 102 72 72
Total $5,463 $6,231 $5,956 $4,390 $5,764 $5,499
Allowance for losses percentage 37.4% 35.8% 36.5% 46.6% 38.7% 39.6%
(a) During the first quarter of 2010, we transferred the Consumer business in Italy from Consumer to CLL. Prior period amounts were reclassified to conform to the current-
period presentation.
(b) Reflects the effects of our adoption of ASU 2009-16 & 17 on January 1, 2010.
IMPAIRED LOANS
The following table provides information about loans classified as impaired and specific reserves related to Commercial.
COMMERCIAL (a)
With no specific allowance With a specific allowance
Recorded Unpaid Average Recorded Unpaid Average
investment principal investment in investment principal Associated investment in
December 31, 2010 (In millions) in loans balance loans in loans balance allowance loans
CLL
Americas $2,030 $2,127 $1,547 $1,699 $1,744 $ 589 $1,754
Europe 802 674 629 566 566 267 563
Asia 119 117 117 338 303 132 334
Other — — 9 — — — —
Total CLL 2,951 2,918 2,302 2,603 2,613 988 2,651
Energy Financial Services 54 61 76 24 24 6 70
GECAS 24 24 50 — — — 31
Other 58 57 30 106 99 37 82
Total $3,087 $3,060 $2,458 $2,733 $2,736 $1,031 $2,834
(a) We recognized $88 million of interest income for the year ended December 31, 2010, principally on a cash basis. A substantial majority of this amount was related to income
recognized in our CLL—Americas business.
CREDIT QUALITY INDICATORS
Substantially all of our Commercial financing receivables portfolio
is secured lending and we assess the overall quality of the port-
folio based on the potential risk of loss measure. The metric
incorporates both the borrower’s credit quality along with any
related collateral protection.
Our internal risk ratings process is an important source of
information in determining our allowance for losses and repre-
sents a comprehensive, statistically validated approach to
evaluate risk in our financing receivables portfolios. In deriving
our internal risk ratings, we stratify our Commercial portfolios
into twenty-one categories of default risk and/or six categories of
loss given default to group into three categories: A, B and C. Our
process starts by developing an internal risk rating for our
borrowers, which is based upon our proprietary models using
data derived from borrower financial statements, agency ratings,
payment history information, equity prices and other commercial
borrower characteristics. We then evaluate the potential risk of
loss for the specific lending transaction in the event of borrower
default, which takes into account such factors as applicable
collateral value, historical loss and recovery rates for similar
transactions, and our collection capabilities. Our internal risk
ratings process and the models we use are subject to regular
monitoring and validation controls. The frequency of rating
updates is set by our credit risk policy, which requires annual
Audit Committee approval. The models are updated on a regular
basis and statistically validated annually, or more frequently as
circumstances warrant.