GE 2010 Annual Report Download - page 41
Download and view the complete annual report
Please find page 41 of the 2010 GE annual report below. You can navigate through the pages in the report by either clicking on the pages listed below, or by using the keyword search tool below to find specific information within the annual report.-
 1
1 -
2
-
3
-
4
-
5
-
6
-
7
-
8
-
9
-
10
-
11
-
12
-
13
-
14
-
15
-
16
-
17
-
18
-
19
-
20
-
21
-
22
-
23
-
24
-
25
-
26
-
27
-
28
-
29
-
30
-
 31
31 -
 32
32 -
 33
33 -
 34
34 -
 35
35 -
 36
36 -
 37
37 -
 38
38 -
 39
39 -
 40
40 -
 41
41 -
 42
42 -
 43
43 -
 44
44 -
 45
45 -
 46
46 -
 47
47 -
 48
48 -
 49
49 -
 50
50 -
 51
51 -
52
-
53
-
54
-
55
-
56
-
57
-
58
-
59
-
60
-
61
-
62
-
63
-
64
-
65
-
66
-
67
-
68
-
69
-
70
-
71
-
72
-
73
-
74
-
75
-
76
-
77
-
78
-
79
-
80
-
81
-
82
-
83
-
84
-
85
-
86
-
87
-
88
-
89
-
90
-
91
-
92
-
93
-
94
-
95
-
96
-
97
-
98
-
99
-
100
-
101
-
102
-
103
-
104
-
105
-
106
-
107
-
108
-
109
-
110
-
111
-
112
-
113
-
114
-
115
-
116
-
117
-
118
-
119
-
120
-
121
-
122
-
123
-
124
-
125
-
126
-
127
-
128
-
129
-
130
-
131
-
132
-
133
-
134
-
135
-
136
-
137
-
138
-
139
-
140
 |
 |

management’s discussion and analsis
GE 2010 ANNUAL REPORT 39
provided supplemental information for certain businesses within
the segments for greater clarity.
Segment profit is determined based on internal performance
measures used by the Chief Executive Officer to assess the per-
formance of each business in a given period. In connection with
that assessment, the Chief Executive Officer may exclude matters
such as charges for restructuring; rationalization and other similar
expenses; in-process research and development and certain
other acquisition-related charges and balances; technology and
product development costs; certain gains and losses from acqui-
sitions or dispositions; and litigation settlements or other charges,
responsibility for which preceded the current management team.
Segment profit excludes the effects of principal pension plans,
results reported as discontinued operations, earnings attributable
to noncontrolling interests of consolidated subsidiaries and
accounting changes. Segment profit excludes or includes interest
and other financial charges and income taxes according to how a
particular segment’s management is measured—excluded in
determining segment profit, which we sometimes refer to as
“operating profit,” for Energy Infrastructure, Technology
Infrastructure, NBC Universal and Home & Business Solutions;
included in determining segment profit, which we sometimes
refer to as “net earnings,” for GE Capital. Beginning January 1,
2011, we will allocate service costs related to our principal pen-
sion plans and we will no longer allocate the retiree costs of our
postretirement healthcare benefits to our segments. This revised
allocation methodology will better align segment operating costs
to the active employee costs, which are managed by the seg-
ments. We do not expect this change to significantly affect
reported segment results.
We have reclassified certain prior-period amounts to conform
to the current-period presentation. For additional information
about our segments, see Note 28.
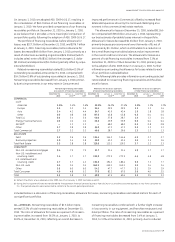
Summary of Operating Segments
General Electric Company and consolidated affiliates
(In millions) 2010 2009 2008 2007 2006
REVENUES
Energy Infrastructure $ 37,514 $ 40,648 $ 43,046 $ 34,880 $ 28,816
Technology Infrastructure 37,860 38,517 41,605 38,338 33,735
NBC Universal 16,901 15,436 16,969 15,416 16,188
GE Capital 47,040 49,746 67,645 67,217 57,943
Home & Business Solutions 8,648 8,443 10,117 11,026 11,654
Total segment revenues 147,963 152,790 179,382 166,877 148,336
Corporate items and eliminations 2,248 2,488 2,199 4,679 2,509
CONSOLIDATED REVENUES $150,211 $155,278 $181,581 $171,556 $150,845
SEGMENT PROFIT
Energy Infrastructure $ 7,271 $ 7,105 $ 6,497 $ 5,238 $ 3,806
Technology Infrastructure 6,314 6,785 7,460 7,186 6,687
NBC Universal 2,261 2,264 3,131 3,107 2,919
GE Capital 3,265 1,462 8,063 12,306 10,324
Home & Business Solutions 457 370 365 983 928
Total segment profit 19,568 17,986 25,516 28,820 24,664
Corporate items and eliminations (3,321) (2,826) (1,909) (1,639) (1,188)
GE interest and other financial charges (1,600) (1,478) (2,153) (1,993) (1,668)
GE provision for income taxes (2,024) (2,739) (3,427) (2,794) (2,553)
Earnings from continuing operations 12,623 10,943 18,027 22,394 19,255
Earnings (loss) from discontinued operations, net of taxes (979) 82 (617) (186) 1,487
CONSOLIDATED NET EARNINGS ATTRIBUTABLE TO THE COMPANY $ 11,644 $ 11,025 $ 17,410 $ 22,208 $ 20,742
See accompanying notes to consolidated financial statements.
ENERGY INFRASTRUCTURE
(In millions) 2010 2009 2008
REVENUES $37,514 $40,648 $43,046
SEGMENT PROFIT $ 7,271 $ 7,105 $ 6,497
REVENUES
Energy $30,854 $33,698 $36,307
Oil & Gas 7,561 7,743 7,417
SEGMENT PROFIT
Energy $ 6,235 $ 6,045 $ 5,485
Oil & Gas 1,205 1,222 1,127
Energy Infrastructure segment revenues decreased 8%, or
$3.1 billion, in 2010 as lower volume ($3.3 billion) and the stron-
ger U.S. dollar ($0.4 billion) were partially offset by higher prices
($0.5 billion) and higher other income ($0.1 billion). Lower volume
primarily reflected decreases in thermal and wind equipment
sales at Energy. The effects of the stronger U.S. dollar were at
both Energy and Oil & Gas. Higher prices at Energy were par-
tially offset by lower prices at Oil & Gas. The increase in other
income at Energy was partially offset by lower other income at
Oil & Gas.