GE 2010 Annual Report Download - page 60
Download and view the complete annual report
Please find page 60 of the 2010 GE annual report below. You can navigate through the pages in the report by either clicking on the pages listed below, or by using the keyword search tool below to find specific information within the annual report.-
 1
1 -
2
-
3
-
4
-
5
-
6
-
7
-
8
-
9
-
10
-
11
-
12
-
13
-
14
-
15
-
16
-
17
-
18
-
19
-
20
-
21
-
22
-
23
-
24
-
25
-
26
-
27
-
28
-
29
-
30
-
31
-
32
-
33
-
34
-
35
-
36
-
37
-
38
-
39
-
40
-
41
-
42
-
43
-
44
-
45
-
46
-
47
-
48
-
49
-
 50
50 -
 51
51 -
 52
52 -
 53
53 -
 54
54 -
 55
55 -
 56
56 -
 57
57 -
 58
58 -
 59
59 -
 60
60 -
 61
61 -
 62
62 -
 63
63 -
 64
64 -
 65
65 -
 66
66 -
 67
67 -
 68
68 -
 69
69 -
 70
70 -
71
-
72
-
73
-
74
-
75
-
76
-
77
-
78
-
79
-
80
-
81
-
82
-
83
-
84
-
85
-
86
-
87
-
88
-
89
-
90
-
91
-
92
-
93
-
94
-
95
-
96
-
97
-
98
-
99
-
100
-
101
-
102
-
103
-
104
-
105
-
106
-
107
-
108
-
109
-
110
-
111
-
112
-
113
-
114
-
115
-
116
-
117
-
118
-
119
-
120
-
121
-
122
-
123
-
124
-
125
-
126
-
127
-
128
-
129
-
130
-
131
-
132
-
133
-
134
-
135
-
136
-
137
-
138
-
139
-
140
 |
 |

management’s discussion and analsis
58 GE 2010 ANNUAL REPORT
GECS Cash Flow
GECS cash and equivalents were $60.3 billion at December 31,
2010, compared with $62.6 billion at December 31, 2009. GECS
cash from operating activities totaled $21.2 billion in 2010,
compared with $7.4 billion in 2009. This was primarily due to
decreases, compared to the prior year, in net cash collateral held
from counterparties on derivative contracts of $6.9 billion, in
cash used for other liabilities of $1.5 billion, higher current-year
earnings, and lower gains and higher impairments at Real Estate
of $2.9 billion.
Consistent with our plan to reduce GECS asset levels, cash from
investing activities was $36.4 billion in 2010. Primary sources were
$26.3 billion resulting from a reduction in financing receivables,
primarily from collections exceeding originations, a $1.8 billion
reduction in investment securities, and $1.6 billion of recoveries
of financing receivables previously written off. Additionally, we
received proceeds of $2.5 billion from sales of discontinued opera-
tions, primarily BAC, and $1.2 billion resulted from proceeds from
business dispositions, including the consumer businesses in
Hong Kong and Indonesia. These sources were partially offset
by cash used for acquisitions of $0.6 billion for the acquisition of
certain financing businesses of the Royal Bank of Scotland.
GECS cash used for financing activities in 2010 reflected our
continued reduction in ending net investment. Cash used for
financing activities of $59.6 billion related primarily to a
$60.3 billion reduction in borrowings consisting primarily of
reductions in long-term borrowings (which includes reductions
related to borrowings consolidated upon the adoption of
ASU 2009-16 & 17) and commercial paper, partially offset by a
$4.6 billion increase in bank deposits.
GECS pays dividends to GE through a distribution of its
retained earnings, including special dividends from proceeds of
certain business sales. Beginning in the first quarter of 2009, GECS
suspended its normal dividend to GE. Dividends paid to GE in 2008
were $2.4 billion. There were no special dividends paid to GE
in 2010, 2009 or 2008.
Intercompany Eliminations
Effects of transactions between related companies are elimi-
nated and consist primarily of GECS dividends to GE or capital
contributions from GE to GECS; GE customer receivables sold to
GECS; GECS services for trade receivables management and
material procurement; buildings and equipment (including auto-
mobiles) leased between GE and GECS; information technology
(IT) and other services sold to GECS by GE; aircraft engines
manufactured by GE that are installed on aircraft purchased by
GECS from third-party producers for lease to others; and various
investments, loans and allocations of GE corporate overhead
costs. For further information related to intercompany elimina-
tions, see Note 27.
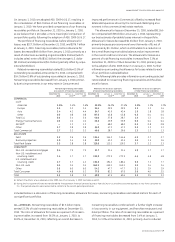
Contractual Obligations
As defined by reporting regulations, our contractual obligations for future payments as of December 31, 2010, follow.
Payments due by period
2016 and
(In billions) Total 2011 2012–2013 2014–2015 thereafter
Borrowings and bank deposits (Note 10) $478.6 $153.9 $146.1 $56.9 $121.7
Interest on borrowings and bank deposits 113.7 13.2 18.5 12.1 69.9
Operating lease obligations (Note 19) 4.8 1.1 1.6 0.9 1.2
Purchase obligations (a) (b) 54.7 34.0 13.2 5.9 1.6
Insurance liabilities (Note 11) (c) 24.8 2.8 3.8 3.3 14.9
Other liabilities (d) 65.2 24.8 11.6 6.3 22.5
Contractual obligations of discontinued operations (e) 2.1 2.1 — — —
(a) Included all take-or-pay arrangements, capital expenditures, contractual commitments to purchase equipment that will be leased to others, contractual commitments
related to factoring agreements, software acquisition/license commitments, contractual minimum programming commitments and any contractually required cash
payments for acquisitions.
(b) Excluded funding commitments entered into in the ordinary course of business by our financial services businesses. Further information on these commitments and other
guarantees is provided in Note 25.
(c) Included contracts with reasonably determinable cash flows such as structured settlements, certain property and casualty contracts, and guaranteed investment contracts.
(d) Included an estimate of future expected funding requirements related to our pension and postretirement benefit plans and included liabilities for unrecognized tax
benefits. Because their future cash outflows are uncertain, the following non-current liabilities are excluded from the table above: deferred taxes, derivatives, deferred
revenue and other sundry items. For further information on certain of these items, see Notes 14 and 22.
(e) Included payments for other liabilities.