GE 2010 Annual Report Download - page 42
Download and view the complete annual report
Please find page 42 of the 2010 GE annual report below. You can navigate through the pages in the report by either clicking on the pages listed below, or by using the keyword search tool below to find specific information within the annual report.-
 1
1 -
2
-
3
-
4
-
5
-
6
-
7
-
8
-
9
-
10
-
11
-
12
-
13
-
14
-
15
-
16
-
17
-
18
-
19
-
20
-
21
-
22
-
23
-
24
-
25
-
26
-
27
-
28
-
29
-
30
-
31
-
 32
32 -
 33
33 -
 34
34 -
 35
35 -
 36
36 -
 37
37 -
 38
38 -
 39
39 -
 40
40 -
 41
41 -
 42
42 -
 43
43 -
 44
44 -
 45
45 -
 46
46 -
 47
47 -
 48
48 -
 49
49 -
 50
50 -
 51
51 -
 52
52 -
53
-
54
-
55
-
56
-
57
-
58
-
59
-
60
-
61
-
62
-
63
-
64
-
65
-
66
-
67
-
68
-
69
-
70
-
71
-
72
-
73
-
74
-
75
-
76
-
77
-
78
-
79
-
80
-
81
-
82
-
83
-
84
-
85
-
86
-
87
-
88
-
89
-
90
-
91
-
92
-
93
-
94
-
95
-
96
-
97
-
98
-
99
-
100
-
101
-
102
-
103
-
104
-
105
-
106
-
107
-
108
-
109
-
110
-
111
-
112
-
113
-
114
-
115
-
116
-
117
-
118
-
119
-
120
-
121
-
122
-
123
-
124
-
125
-
126
-
127
-
128
-
129
-
130
-
131
-
132
-
133
-
134
-
135
-
136
-
137
-
138
-
139
-
140
 |
 |

management’s discussion and analsis
40 GE 2010 ANNUAL REPORT
Segment profit increased 2% to $7.3 billion in 2010, compared
with $7.1 billion in 2009 as higher prices ($0.5 billion), the effects of
deflation ($0.4 billion) and higher other income ($0.1 billion) were
partially offset by lower volume ($0.6 billion), the stronger U.S. dol-
lar ($0.1 billion) and decreased productivity ($0.1 billion). Higher
prices at Energy were partially offset by lower prices at Oil & Gas.
The effects of deflation primarily reflected decreased material
costs at both Energy and Oil & Gas. An increase in other income at
Energy was partially offset by lower other income at Oil & Gas.
Lower volume primarily reflected decreases in wind and thermal
equipment sales at Energy and was partially offset by higher
volume at Oil & Gas. The effects of the stronger U.S. dollar were at
both Energy and Oil & Gas. The effects of decreased productivity
were primarily at Energy.
Energy Infrastructure segment revenues decreased 6%, or
$2.4 billion, in 2009 as higher prices ($1.3 billion) were more than
offset by lower volume ($2.5 billion), the stronger U.S. dollar
($0.8 billion) and lower other income ($0.4 billion), primarily related
to lower earnings from associated companies and marks on
foreign currency contracts. The increase in price was primarily at
Energy. The decrease in volume reflected decreased equipment
sales at Energy, partially offset by increased equipment sales at
Oil & Gas. The effects of the stronger U.S. dollar were at both
Energy and Oil & Gas.
Segment profit increased 9% to $7.1 billion in 2009, compared
with $6.5 billion in 2008, as higher prices ($1.3 billion) and lower
material and other costs ($0.5 billion) were partially offset by lower
other income ($0.7 billion), primarily related to lower earnings
from associated companies and marks on foreign currency con-
tracts, lower volume ($0.3 billion) and lower productivity
($0.1 billion). Lower material and other costs were primarily at
Energy. Lower volume at Energy was partially offset by higher
volume at Oil & Gas. The effects of lower productivity were
at Energy.
Energy Infrastructure segment orders were $39.4 billion in
both 2010 and 2009. The $27.3 billion total backlog at year-end
2010 comprised unfilled product orders of $18.4 billion (of which
77% was scheduled for delivery in 2011) and product services
orders of $8.9 billion scheduled for 2011 delivery. Comparable
December 31, 2009, total backlog was $29.1 billion, of which
$20.0 billion was for unfilled product orders and $9.1 billion, for
product services orders. See Corporate Items and Eliminations
for a discussion of items not allocated to this segment.
TECHNOLOGY INFRASTRUCTURE
(In millions) 2010 2009 2008
REVENUES $37,860 $38,517 $41,605
SEGMENT PROFIT $ 6,314 $ 6,785 $ 7,460
REVENUES
Aviation $17,619 $18,728 $19,239
Healthcare 16,897 16,015 17,392
Transportation 3,370 3,827 5,016
SEGMENT PROFIT
Aviation $ 3,304 $ 3,923 $ 3,684
Healthcare 2,741 2,420 2,851
Transportation 315 473 962
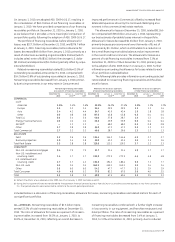
Technology Infrastructure revenues decreased 2%, or $0.7 bil-
lion, in 2010 as lower volume ($0.6 billion) and lower other
income ($0.1 billion), reflecting lower transaction gains, were
partially offset by the weaker U.S. dollar ($0.1 billion). The
decrease in volume reflected decreased commercial and military
equipment sales and services at Aviation and decreased equip-
ment sales and services at Transportation, partially offset by
increased equipment sales and services at Healthcare. Lower
transaction gains reflect the absence of gains related to the
Airfoils Technologies International—Singapore Pte. Ltd. (ATI)
acquisition and the Times Microwave Systems disposition in
2009, partially offset by a gain on a partial sale of a materials
business and a franchise fee at Aviation. The effects of the
weaker U.S. dollar were primarily at Healthcare.
Segment profit decreased 7% to $6.3 billion in 2010, compared
with $6.8 billion in 2009, from lower productivity ($0.3 billion),
lower other income ($0.1 billion), reflecting lower transaction
gains, lower volume ($0.1 billion) and the effects of inflation
($0.1 billion), partially offset by the weaker U.S. dollar ($0.1 billion).
Lower productivity at Aviation, primarily due to product launch
and production costs associated with the GEnx engine ship-
ments, and at Transportation, primarily due to higher service
costs, was partially offset by increased productivity at Healthcare.
Lower transaction gains reflect the absence of gains related to
the ATI acquisition and the Times Microwave Systems disposition
in 2009, partially offset by a gain on a partial sale of a materials
business and a franchise fee at Aviation. The decreases in
volume were at Aviation and Transportation, partially offset by
Healthcare. The effects of inflation were primarily at Aviation
and Healthcare. The effects of the weaker U.S. dollar were pri-
marily at Healthcare.
Technology Infrastructure revenues decreased 7%, or $3.1 bil-
lion, in 2009 as lower volume ($3.2 billion), the stronger U.S. dollar
($0.3 billion) and an update at Transportation of our estimate of
product service costs in maintenance service agreements
($0.3 billion) were partially offset by higher prices ($0.5 billion) and
higher other income ($0.3 billion), primarily including gains on the
ATI acquisition and the Times Microwave Systems disposition.
The decrease in volume was across all businesses in the seg-
ment. The effects of the stronger U.S. dollar were at Healthcare
and Aviation. Higher prices, primarily at Aviation, were partially
offset by lower prices at Healthcare.
Segment profit decreased 9% to $6.8 billion in 2009, compared
with $7.5 billion in 2008, as the effects of lower volume ($0.9 bil-
lion), lower productivity ($0.4 billion) and higher other costs
($0.1 billion) were partially offset by higher prices ($0.5 billion) and
higher other income ($0.2 billion), primarily including gains on the
ATI acquisition and the Times Microwave Systems disposition.
The decrease in volume was across all businesses in the segment.
Lower productivity at Transportation was partially offset by Aviation.
Technology Infrastructure orders increased to $41.5 billion
in 2010, from $37.9 billion in 2009. The $39.4 billion total backlog at
year-end 2010 comprised unfilled product orders of $27.7 billion
(of which 46% was scheduled for delivery in 2011) and product