GE 2010 Annual Report Download - page 132
Download and view the complete annual report
Please find page 132 of the 2010 GE annual report below. You can navigate through the pages in the report by either clicking on the pages listed below, or by using the keyword search tool below to find specific information within the annual report.-
 1
1 -
2
-
3
-
4
-
5
-
6
-
7
-
8
-
9
-
10
-
11
-
12
-
13
-
14
-
15
-
16
-
17
-
18
-
19
-
20
-
21
-
22
-
23
-
24
-
25
-
26
-
27
-
28
-
29
-
30
-
31
-
32
-
33
-
34
-
35
-
36
-
37
-
38
-
39
-
40
-
41
-
42
-
43
-
44
-
45
-
46
-
47
-
48
-
49
-
50
-
51
-
52
-
53
-
54
-
55
-
56
-
57
-
58
-
59
-
60
-
61
-
62
-
63
-
64
-
65
-
66
-
67
-
68
-
69
-
70
-
71
-
72
-
73
-
74
-
75
-
76
-
77
-
78
-
79
-
80
-
81
-
82
-
83
-
84
-
85
-
86
-
87
-
88
-
89
-
90
-
91
-
92
-
93
-
94
-
95
-
96
-
97
-
98
-
99
-
100
-
101
-
102
-
103
-
104
-
105
-
106
-
107
-
108
-
109
-
110
-
111
-
112
-
113
-
114
-
115
-
116
-
117
-
118
-
119
-
120
-
121
-
 122
122 -
 123
123 -
 124
124 -
 125
125 -
 126
126 -
 127
127 -
 128
128 -
 129
129 -
 130
130 -
 131
131 -
 132
132 -
 133
133 -
 134
134 -
 135
135 -
 136
136 -
 137
137 -
 138
138 -
 139
139 -
 140
140
 |
 |

130 GE 2010 ANNUAL REPORT
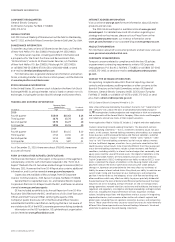
Note 29.
Quarterly Information (Unaudited)
First quarter Second quarter Third quarter Fourth quarter
(In millions; per-share amounts in dollars) 2010 2009 2010 2009 2010 2009 2010 2009
CONSOLIDATED OPERATIONS
Earnings from continuing operations $ 2,370 $ 2,934 $ 3,340 $ 2,673 $ 3,289 $ 2,441 $ 4,159 $ 3,095
Earnings (loss) from discontinued operations (374) (20) (133) 29 (1,077) 53 605 20
Net earnings 1,996 2,914 3,207 2,702 2,212 2,494 4,764 3,115
Less net earnings attributable to
noncontrolling interests (52) (85) (97) (12) (157) (1) (229) (102)
Net earnings attributable to the Company 1,944 2,829 3,110 2,690 2,055 2,493 4,535 3,013
Preferred stock dividends declared (75) (75) (75) (75) (75) (75) (75) (75)
Net earnings attributable to GE
common shareowners $ 1,869 $ 2,754 $ 3,035 $ 2,615 $ 1,980 $ 2,418 $ 4,460 $ 2,938
Per-share amounts—earnings
from continuing operations
Diluted earnings per share $ 0.21 $ 0.26 $ 0.30 $ 0.24 $ 0.29 $ 0.22 $ 0.36 $ 0.27
Basic earnings per share 0.21 0.26 0.30 0.24 0.29 0.22 0.36 0.27
Per-share amounts—earnings (loss)
from discontinued operations
Diluted earnings per share (0.04) — (0.01) — (0.10) — 0.06 —
Basic earnings per share (0.04) — (0.01) —
(0.10) — 0.06 —
Per-share amounts—net earnings
Diluted earnings per share 0.17 0.26 0.28 0.25 0.18 0.23 0.42 0.28
Basic earnings per share 0.17 0.26 0.28 0.25 0.18 0.23 0.42 0.28
SELECTED DATA
GE
Sales of goods and services $23,509 $24,023 $24,403 $26,013 $23,593 $25,123 $28,715 $28,298
Gross profit from sales 6,146 6,013 7,294 7,234 6,974 6,560 8,278 7,886
GECS
Total revenues 12,796 14,278 12,790 12,943 12,099 12,325 12,814 13,112
Earnings from continuing operations
attributable to the Company 523 978 767 144 804 120 1,036 73
For GE, gross profit from sales is sales of goods and services less costs of goods and services sold.
Earnings-per-share amounts are computed independently each quarter for earnings from continuing operations, earnings (loss) from
discontinued operations and net earnings. As a result, the sum of each quarter’s per-share amount may not equal the total per-share
amount for the respective year; and the sum of per-share amounts from continuing operations and discontinued operations may not
equal the total per-share amounts for net earnings for the respective quarters.