GE 2010 Annual Report Download - page 50
Download and view the complete annual report
Please find page 50 of the 2010 GE annual report below. You can navigate through the pages in the report by either clicking on the pages listed below, or by using the keyword search tool below to find specific information within the annual report.-
 1
1 -
2
-
3
-
4
-
5
-
6
-
7
-
8
-
9
-
10
-
11
-
12
-
13
-
14
-
15
-
16
-
17
-
18
-
19
-
20
-
21
-
22
-
23
-
24
-
25
-
26
-
27
-
28
-
29
-
30
-
31
-
32
-
33
-
34
-
35
-
36
-
37
-
38
-
39
-
 40
40 -
 41
41 -
 42
42 -
 43
43 -
 44
44 -
 45
45 -
 46
46 -
 47
47 -
 48
48 -
 49
49 -
 50
50 -
 51
51 -
 52
52 -
 53
53 -
 54
54 -
 55
55 -
 56
56 -
 57
57 -
 58
58 -
 59
59 -
 60
60 -
61
-
62
-
63
-
64
-
65
-
66
-
67
-
68
-
69
-
70
-
71
-
72
-
73
-
74
-
75
-
76
-
77
-
78
-
79
-
80
-
81
-
82
-
83
-
84
-
85
-
86
-
87
-
88
-
89
-
90
-
91
-
92
-
93
-
94
-
95
-
96
-
97
-
98
-
99
-
100
-
101
-
102
-
103
-
104
-
105
-
106
-
107
-
108
-
109
-
110
-
111
-
112
-
113
-
114
-
115
-
116
-
117
-
118
-
119
-
120
-
121
-
122
-
123
-
124
-
125
-
126
-
127
-
128
-
129
-
130
-
131
-
132
-
133
-
134
-
135
-
136
-
137
-
138
-
139
-
140
 |
 |

management’s discussion and analsis
48 GE 2010 ANNUAL REPORT
estimates can significantly affect the allowance and provision for
losses. It is possible to experience credit losses that are different
from our current estimates.
Our risk management process includes standards and policies
for reviewing major risk exposures and concentrations, and evalu-
ates relevant data either for individual loans or financing leases, or
on a portfolio basis, as appropriate.
Loans acquired in a business acquisition are recorded at fair
value, which incorporates our estimate at the acquisition date of
the credit losses over the remaining life of the portfolio. As a
result, the allowance for losses is not carried over at acqui sition.
This may have the effect of causing lower reserve coverage ratios
for those portfolios.
For purposes of the discussion that follows, “delinquent”
receivables are those that are 30 days or more past due based on
their contractual terms; and “nonearning” receivables are those
that are 90 days or more past due (or for which collection is other-
wise doubtful). Nonearning receivables exclude loans purchased
at a discount (unless they have deteriorated post-acquisition).
Under ASC 310, Receivables, these loans are initially recorded at
fair value and accrete interest income over the estimated life of
the loan based on reasonably estimable cash flows even if the
underlying loans are contractually delinquent at acquisition. In
addition, nonearning receivables exclude loans that are paying on
a cash accounting basis but classified as nonaccrual and impaired.
“Nonaccrual” financing receivables include all nonearning receiv-
ables and are those on which we have stopped accruing interest.
We stop accruing interest at the earlier of the time at which col-
lection of an account becomes doubtful or the account becomes
90 days past due. Recently restructured financing receivables are
not considered delinquent when payments are brought current
according to the restructured terms, but may remain classified as
nonaccrual until there has been a period of satisfactory payment
performance by the borrower and future payments are reason-
ably assured of collection.
Further information on the determination of the allowance for
losses on financing receivables and the credit quality and catego-
rization of our financing receivables is provided in the Critical
Accounting Estimates section and Notes 1, 6 and 23.
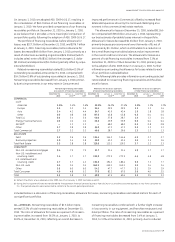
Financing receivables at Nonearning receivables at Allowance for losses at
December 31, January 1, December 31, December 31, January 1, December 31, December 31, January 1, December 31,
(In millions) 2010 2010 (a) 2009 2010 2010 (a) 2009 2010 2010 (a) 2009
COMMERCIAL
CLL (b)
Americas $ 86,596 $ 99,666 $ 87,496 $ 2,571 $ 3,437 $ 3,155 $1,287 $1,245 $1,179
Europe 37,498 43,403 41,455 1,241 1,441 1,441 429 575 575
Asia 11,943 13,159 13,202 406 559 576 222 234 244
Other 2,626 2,836 2,836 8 24 24 7 11 11
Total CLL 138,663 159,064 144,989 4,226 5,461 5,196 1,945 2,065 2,009
Energy Financial Services 7,011 7,790 7,790 62 78 78 22 28 28
GECAS
(b) 12,615 13,254 13,254 — 153 153 20 104 104
Other (c) 1,788 2,614 2,614 102 72 72 58 34 34
Total Commercial 160,077 182,722 168,647 4,390 5,764 5,499 2,045 2,231 2,175
REAL ESTATE
Debt (d) 30,249 36,257 36,565 961 939 939 1,292 1,355 1,358
Business properties (e) 9,962 12,416 8,276 386 419 313 196 181 136
Total Real Estate 40,211 48,673 44,841 1,347 1,358 1,252 1,488 1,536 1,494
CONSUMER (b)
Non-U.S. residential mortgages (f) 45,536 54,921 54,921 3,812 4,331 4,331 828 926 926
Non-U.S. installment
and revolving credit 20,368 23,443 23,443 290 409 409 945 1,116 1,116
U.S. installment and
revolving credit 43,974 44,008 20,027 1,201 1,624 832 2,333 3,153 1,551
Non-U.S. auto 8,877 12,762 12,762 48 66 66 174 303 303
Other 8,306 10,156 10,156 478 610 610 259 291 291
Total Consumer 127,061 145,290 121,309 5,829 7,040 6,248 4,539 5,789 4,187
Total $327,349 $376,685 $334,797 $11,566 $14,162 $12,999 $8,072 $9,556 $7,856
(a) Reflects the effects of our adoption of ASU 2009-16 & 17 on January 1, 2010. See Notes 6 and 23.
(b) During the first quarter of 2010, we transferred the Transportation Financial Services business from GECAS to CLL and the Consumer business in Italy from Consumer to
CLL. Prior-period amounts were reclassified to conform to the current-period presentation.
(c) Primarily consisted of loans and financing leases in former consolidated, liquidating securitization entities, which became wholly owned affiliates in December 2010.
(d) Financing receivables included $218 million and $317 million of construction loans at December 31, 2010 and December 31, 2009, respectively.
(e) Our Business properties portfolio is underwritten primarily by the credit quality of the borrower and secured by tenant and owner-occupied commercial properties.
(f) At December 31, 2010, net of credit insurance, approximately 24% of our secured Consumer non-U.S. residential mortgage portfolio comprised loans with introductory,
below market rates that are scheduled to adjust at future dates; with high loan-to-value ratios at inception (greater than 90%); whose terms permitted interest-only
payments; or whose terms resulted in negative amortization. At origination, we underwrite loans with an adjustable rate to the reset value. Of these loans, 82% are in our
U.K. and France portfolios, which comprise mainly loans with interest-only payments and introductory below market rates, have a delinquency rate of 15%, have a loan-to-
value ratio at origination of 75% and have re-indexed loan-to-value ratios of 83% and 60%, respectively. At December 31, 2010, 4% (based on dollar values) of these loans in
our U.K. and France portfolios have been restructured.