GE 2010 Annual Report Download - page 49
Download and view the complete annual report
Please find page 49 of the 2010 GE annual report below. You can navigate through the pages in the report by either clicking on the pages listed below, or by using the keyword search tool below to find specific information within the annual report.-
 1
1 -
2
-
3
-
4
-
5
-
6
-
7
-
8
-
9
-
10
-
11
-
12
-
13
-
14
-
15
-
16
-
17
-
18
-
19
-
20
-
21
-
22
-
23
-
24
-
25
-
26
-
27
-
28
-
29
-
30
-
31
-
32
-
33
-
34
-
35
-
36
-
37
-
38
-
 39
39 -
 40
40 -
 41
41 -
 42
42 -
 43
43 -
 44
44 -
 45
45 -
 46
46 -
 47
47 -
 48
48 -
 49
49 -
 50
50 -
 51
51 -
 52
52 -
 53
53 -
 54
54 -
 55
55 -
 56
56 -
 57
57 -
 58
58 -
 59
59 -
60
-
61
-
62
-
63
-
64
-
65
-
66
-
67
-
68
-
69
-
70
-
71
-
72
-
73
-
74
-
75
-
76
-
77
-
78
-
79
-
80
-
81
-
82
-
83
-
84
-
85
-
86
-
87
-
88
-
89
-
90
-
91
-
92
-
93
-
94
-
95
-
96
-
97
-
98
-
99
-
100
-
101
-
102
-
103
-
104
-
105
-
106
-
107
-
108
-
109
-
110
-
111
-
112
-
113
-
114
-
115
-
116
-
117
-
118
-
119
-
120
-
121
-
122
-
123
-
124
-
125
-
126
-
127
-
128
-
129
-
130
-
131
-
132
-
133
-
134
-
135
-
136
-
137
-
138
-
139
-
140
 |
 |
management’s discussion and analsis
GE 2010 ANNUAL REPORT 47
and securitization retained interests) and corporate debt securi-
ties, respectively. With respect to our investment securities that
are in an unrealized loss position at December 31, 2010, the vast
majority relate to debt securities held to support obligations to
holders of GICs and annuitants and policyholders in our run-off
insurance operations. We presently do not intend to sell our debt
securities and believe that it is not more likely than not that we will
be required to sell these securities that are in an unrealized loss
position before recovery of our amortized cost. For additional
information, see Note 3.
FAIR VALUE MEASUREMENTS. For financial assets and liabilities
measured at fair value on a recurring basis, fair value is the
price we would receive to sell an asset or pay to transfer a
liability in an orderly transaction with a market participant at
the measurement date. In the absence of active markets for the
identical assets or liabilities, such measurements involve devel-
oping assumptions based on market observable data and, in
the absence of such data, internal information that is consistent
with what market participants would use in a hypothetical
transaction that occurs at the measurement date. Additional
information about our application of this guidance is provided
in Notes 1 and 21.
Investments measured at fair value in earnings include equity
investments of $0.8 billion at year-end 2010. The earnings effects
of changes in fair value on these assets, favorable and unfavor-
able, will be reflected in the period in which those changes occur.
As discussed in Note 9, we also have assets that are classified as
held for sale in the ordinary course of business, loans and real
estate properties, carried at $3.5 billion at year-end 2010, which
represents the lower of carrying amount or estimated fair value
less costs to sell. To the extent that the estimated fair value less
costs to sell is lower than carrying value, any favorable or unfavor-
able changes in fair value will be reflected in earnings in the
period in which such changes occur.
WORKING CAPITAL, representing GE current receivables and
inventories, less GE accounts payable and progress collections,
was $(1.6) billion at December 31, 2010, down an insignificant
amount from December 31, 2009, as reductions in inventory
and an increase in accounts payable were offset by higher
current receivables and lower progress collections. As Energy
Infrastructure and Technology Infrastructure deliver units out
of their backlogs over the next few years, progress collections of
$11.8 billion at December 31, 2010, will be earned, which, along
with progress collections on new orders, will impact working
capital. Throughout the last four years, we have executed a
significant number of initiatives through our Operating Council,
such as lean cycle time projects, which have resulted in a more
efficient use of working capital. We expect to continue these
initiatives in 2011, which should significantly offset the effects
of decreases in progress collections.
We discuss current receivables and inventories, two important
elements of working capital, in the following paragraphs.
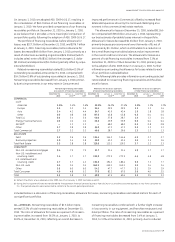
CURRENT RECEIVABLES for GE totaled $10.4 billion at the end of
2010 and $9.8 billion at the end of 2009, and included $8.1 bil-
lion due from customers at the end of 2010 compared with
$7.5 billion at the end of 2009. GE current receivables turnover
was 8.6 in 2010, compared with 8.2 in 2009. The overall increase
in current receivables was primarily due to the higher volume in
Technology Infrastructure businesses.
INVENTORIES for GE totaled to $11.5 billion at December 31,
2010, down $0.5 billion from the end of 2009. This decrease
reflected lower inventories at Energy Infrastructure, partially
offset by higher inventories at Technology Infrastructure.
GE inventory turnover was 7.2 and 6.8 in 2010 and 2009,
respectively. See Note 5.
FINANCING RECEIVABLES is our largest category of assets
and represents one of our primary sources of revenues. Our
port folio of financing receivables is diverse and not directly
comparable to major U.S. banks. A discussion of the quality of
certain elements of the financing receivables portfolio follows.
Our consumer portfolio is largely non-U.S. and primarily com-
prises mortgage, sales finance, auto and personal loans in various
European and Asian countries. Our U.S. consumer financing receiv-
ables comprise 14% of our total portfolio. Of those, approximately
63% relate primarily to credit cards, which are often subject to
profit and loss sharing arrangements with the retailer (the results
of which are reflected in revenues), and have a smaller average
balance and lower loss severity as compared to bank cards. The
remaining 37% are sales finance receivables, which provide elec-
tronics, recreation, medical and home improvement financing to
customers. In 2007, we exited the U.S. mortgage business and
we have no U.S. auto or student loans.
Our commercial portfolio primarily comprises senior, secured
positions with comparatively low loss history. The secured receiv-
ables in this portfolio are collateralized by a variety of asset
classes, which for our CLL business primarily include: industrial-
related facilities and equipment, vehicles, corporate aircraft and
equipment used in many industries, including the construction,
manufacturing, transportation, media, communications, enter-
tainment and healthcare industries. The portfolios in our Real
Estate, GECAS and Energy Financial Services businesses are col-
lateralized by commercial real estate, commercial aircraft and
operating assets in the global energy and water industries,
respectively. We are in a secured position for substantially all
of our commercial portfolio.
Losses on financing receivables are recognized when they are
incurred, which requires us to make our best estimate of probable
losses inherent in the portfolio. The method for calculating the
best estimate of losses depends on the size, type and risk charac-
teristics of the related financing receivable. Such an estimate
requires consideration of historical loss experience, adjusted for
current conditions, and judgments about the probable effects of
relevant observable data, including present economic conditions
such as delinquency rates, financial health of specific customers
and market sectors, collateral values (including housing price
indices as applicable), and the present and expected future levels
of interest rates. The underlying assumptions, estimates and
assessments we use to provide for losses are updated periodically
to reflect our view of current conditions. Changes in such