GE 2010 Annual Report Download - page 105
Download and view the complete annual report
Please find page 105 of the 2010 GE annual report below. You can navigate through the pages in the report by either clicking on the pages listed below, or by using the keyword search tool below to find specific information within the annual report.-
 1
1 -
2
-
3
-
4
-
5
-
6
-
7
-
8
-
9
-
10
-
11
-
12
-
13
-
14
-
15
-
16
-
17
-
18
-
19
-
20
-
21
-
22
-
23
-
24
-
25
-
26
-
27
-
28
-
29
-
30
-
31
-
32
-
33
-
34
-
35
-
36
-
37
-
38
-
39
-
40
-
41
-
42
-
43
-
44
-
45
-
46
-
47
-
48
-
49
-
50
-
51
-
52
-
53
-
54
-
55
-
56
-
57
-
58
-
59
-
60
-
61
-
62
-
63
-
64
-
65
-
66
-
67
-
68
-
69
-
70
-
71
-
72
-
73
-
74
-
75
-
76
-
77
-
78
-
79
-
80
-
81
-
82
-
83
-
84
-
85
-
86
-
87
-
88
-
89
-
90
-
91
-
92
-
93
-
94
-
 95
95 -
 96
96 -
 97
97 -
 98
98 -
 99
99 -
 100
100 -
 101
101 -
 102
102 -
 103
103 -
 104
104 -
 105
105 -
 106
106 -
 107
107 -
 108
108 -
 109
109 -
 110
110 -
 111
111 -
 112
112 -
 113
113 -
 114
114 -
 115
115 -
116
-
117
-
118
-
119
-
120
-
121
-
122
-
123
-
124
-
125
-
126
-
127
-
128
-
129
-
130
-
131
-
132
-
133
-
134
-
135
-
136
-
137
-
138
-
139
-
140
 |
 |

GE 2010 ANNUAL REPORT 103
Principal components of our net liability (asset) representing
deferred income tax balances are as follows:
December 31 (In millions) 2010 2009
GE
Intangible assets $ 2,772 $ 2,782
Contract costs and estimated earnings 2,671 2,540
Depreciation 951 1,223
Investment in subsidiaries 1,934 1,959
Provision for expenses
(a) (8,510) (7,843)
Retiree insurance plans (3,814) (4,110)
Non-U.S. loss carryforwards
(b) (1,115) (1,056)
Other—net 874 (115)
(4,237) (4,620)
GECS
Financing leases 6,168 6,210
Operating leases 4,812 5,557
Investment in global subsidiaries 1,406 342
Intangible assets 1,567 1,568
Allowance for losses (2,822) (3,052)
Cash flow hedges (612) (818)
Net unrealized losses on securities (276) (193)
Non-U.S. loss carryforwards
(b) (2,320) (1,244)
Other—net (846) (1,669)
7,077 6,701
Net deferred income tax liability $ 2,840 $ 2,081
(a) Represented the tax effects of temporary differences related to expense accruals
for a wide variety of items, such as employee compensation and benefits, pension
plan liabilities, interest on tax liabilities, product warranties and other sundry items
that are not currently deductible.
(b) Net of valuation allowances of $902 million and $835 million for GE and
$419 million and $344 million for GECS, for 2010 and 2009, respectively. Of the
net deferred tax asset as of December 31, 2010, of $3,435 million, $56 million
relates to net operating loss carryforwards that expire in various years ending
from December 31, 2011, through December 31, 2013; $301 million relates to net
operating losses that expire in various years ending from December 31, 2014,
through December 31, 2025; and $3,078 million relates to net operating loss
carryforwards that may be carried forward indefinitely.
DEFERRED INCOME TAXES
Aggregate deferred income tax amounts are summarized below.
December 31 (In millions) 2010 2009
ASSETS
GE $(14,843) $(14,945)
GECS (12,915) (11,008)
(27,758) (25,953)
LIABILITIES
GE 10,606 10,325
GECS 19,992 17,709
30,598 28,034
Net deferred income tax liability $ 2,840 $ 2,081
We classify interest on tax deficiencies as interest expense; we classify income tax penalties as provision for income taxes. For the years
ended December 31, 2010, 2009 and 2008, $75 million of interest income and $172 million and $268 million of interest expense, respectively,
and $5 million, $14 million and $19 million of tax expenses related to penalties, respectively, were recognized in the Statement of Earnings.
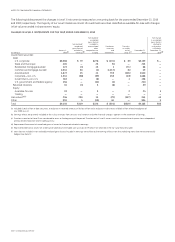
A reconciliation of the U.S. federal statutory income tax rate to the actual income tax rate is provided below.
RECONCILIATION OF U.S. FEDERAL STATUTORY INCOME TAX RATE TO ACTUAL INCOME TAX RATE
Consolidated GE GECS
2010 2009 2008 2010 2009 2008 2010 2009 2008
U.S. federal statutory income tax rate 35.0% 35.0% 35.0% 35.0% 35.0% 35.0% 35.0% 35.0% 35.0%
Increase (reduction) in rate resulting from
Inclusion of after-tax earnings of GECS in
before-tax earnings of GE — — — (7.2) (3.3) (12.3) — — —
Tax on global activities including exports
(a)(b) (19.7) (39.6) (25.8) (10.7) (10.9) (5.2) (54.1) 96.0 (70.7)
U.S. business credits (4.4) (4.5) (1.4) (2.2) (1.0) (0.3) (13.4) 12.4 (3.7)
All other—net (3.5) (2.4) (2.2) (1.6) — (1.5) (12.3) 8.6 (2.0)
(27.6) (46.5) (29.4) (21.7) (15.2) (19.3) (79.8) 117.0 (76.4)
Actual income tax rate 7.4% (11.5)% 5.6% 13.3% 19.8% 15.7% (44.8)% 152.0% (41.4)%
(a) 2009 included (7.0)% and 27.4% from indefinite reinvestment of prior-year earnings for consolidated and GECS, respectively.
(b) 2008 included (1.8)% and (6.2)% from indefinite reinvestment of prior-year earnings for consolidated and GECS, respectively.