GE 2010 Annual Report Download - page 135
Download and view the complete annual report
Please find page 135 of the 2010 GE annual report below. You can navigate through the pages in the report by either clicking on the pages listed below, or by using the keyword search tool below to find specific information within the annual report.-
 1
1 -
2
-
3
-
4
-
5
-
6
-
7
-
8
-
9
-
10
-
11
-
12
-
13
-
14
-
15
-
16
-
17
-
18
-
19
-
20
-
21
-
22
-
23
-
24
-
25
-
26
-
27
-
28
-
29
-
30
-
31
-
32
-
33
-
34
-
35
-
36
-
37
-
38
-
39
-
40
-
41
-
42
-
43
-
44
-
45
-
46
-
47
-
48
-
49
-
50
-
51
-
52
-
53
-
54
-
55
-
56
-
57
-
58
-
59
-
60
-
61
-
62
-
63
-
64
-
65
-
66
-
67
-
68
-
69
-
70
-
71
-
72
-
73
-
74
-
75
-
76
-
77
-
78
-
79
-
80
-
81
-
82
-
83
-
84
-
85
-
86
-
87
-
88
-
89
-
90
-
91
-
92
-
93
-
94
-
95
-
96
-
97
-
98
-
99
-
100
-
101
-
102
-
103
-
104
-
105
-
106
-
107
-
108
-
109
-
110
-
111
-
112
-
113
-
114
-
115
-
116
-
117
-
118
-
119
-
120
-
121
-
122
-
123
-
124
-
 125
125 -
 126
126 -
 127
127 -
 128
128 -
 129
129 -
 130
130 -
 131
131 -
 132
132 -
 133
133 -
 134
134 -
 135
135 -
 136
136 -
 137
137 -
 138
138 -
 139
139 -
 140
140
 |
 |

GE 2010 ANNUAL REPORT 133
GE Capital Ending Net Investment (ENI),
Excluding Cash and Equivalents
December 31, January 1
(In billions) 2010 2010
GECC total assets $581.1 $653.6
Less assets of discontinued operations 5.2 15.1
Less non-interest bearing liabilities 38.9 50.3
GE Capital ENI 537.0 588.2
Less cash and equivalents 59.6 61.9
GE Capital ENI, excluding cash and equivalents $477.4 $526.3
We use ENI to measure the size of our GE Capital segment. We
believe that this measure is a useful indicator of the capital (debt
or equity) required to fund a business as it adjusts for non-inter-
est bearing current liabilities generated in the normal course of
business that do not require a capital outlay. We also believe that
by excluding cash and equivalents, we provide a meaningful
measure of assets requiring capital to fund our GE Capital seg-
ment, as a substantial amount of this cash and equivalents
resulted from debt issuances to pre-fund future debt maturities
and will not be used to fund additional assets. Providing this
measure will help investors measure how we are performing
against our previously communicated goal to reduce the size
of our financial services segment.
GE Pre-Tax Earnings from Continuing Operations, Excluding
GECS Earnings from Continuing Operations and the
Corresponding Effective Tax Rates
(Dollars in millions) 2010 2009 2008
GE earnings from continuing
operations before income taxes $15,166 $13,867 $21,864
Less GECS earnings from
continuing operations 3,130 1,315 7,712
Total $12,036 $12,552 $14,152
GE provision for income taxes $ 2,024 $ 2,739 $ 3,427
GE effective tax rate,
excluding GECS earnings 16.8% 21.8% 24.2%
Reconciliation of U.S. Federal Statutory Income Tax Rate to
GE Effective Tax Rate, Excluding GECS Earnings
2010 2009 2008
U.S. federal statutory income tax rate 35.0% 35.0% 35.0%
Reduction in rate resulting from
Tax on global activities
including exports (13.5) (12.0) (8.0)
U.S. business credits (2.8) (1.1) (0.5)
All other—net (1.9) (0.1) (2.3)
(18.2) (13.2) (10.8)
GE effective tax rate,
excluding GECS earnings 16.8% 21.8% 24.2%
We believe that the GE effective tax rate is best analyzed in rela-
tion to GE earnings before income taxes excluding the GECS net
earnings from continuing operations, as GE tax expense does
not include taxes on GECS earnings. Management believes that
in addition to the Consolidated and GECS tax rates shown in
Note 14, this supplemental measure provides investors with
useful information as it presents the GE effective tax rate that
can be used in comparing the GE results to other non-financial
services businesses.
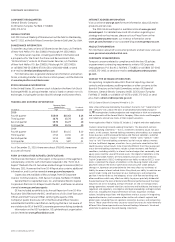
Five-Year Financial Performance Graph: 2006 – 2010
COMPARISON OF FIVE-YEAR CUMULATIVE RETURN AMONG
GE, S&P 500 AND DOW JONES INDUSTRIAL AVERAGE
The annual changes for the five-year period shown in the
graph on this page are based on the assumption that $100 had
been invested in GE stock, the Standard & Poor’s 500 Stock
Index (S&P 500) and the Dow Jones Industrial Average (DJIA) on
December 31, 2005, and that all quarterly dividends were rein-
vested. The total cumulative dollar returns shown on the graph
represent the value that such investments would have had on
December 31, 2010.
2005 2006 2007 2008 2009 2010
GE $100 $109 $112 $51 $ 50 $ 62
S&P 500 100 116 122 77 97 112
DJIA 100 119 130 88 108 123