GE 2010 Annual Report Download - page 53
Download and view the complete annual report
Please find page 53 of the 2010 GE annual report below. You can navigate through the pages in the report by either clicking on the pages listed below, or by using the keyword search tool below to find specific information within the annual report.-
 1
1 -
2
-
3
-
4
-
5
-
6
-
7
-
8
-
9
-
10
-
11
-
12
-
13
-
14
-
15
-
16
-
17
-
18
-
19
-
20
-
21
-
22
-
23
-
24
-
25
-
26
-
27
-
28
-
29
-
30
-
31
-
32
-
33
-
34
-
35
-
36
-
37
-
38
-
39
-
40
-
41
-
42
-
 43
43 -
 44
44 -
 45
45 -
 46
46 -
 47
47 -
 48
48 -
 49
49 -
 50
50 -
 51
51 -
 52
52 -
 53
53 -
 54
54 -
 55
55 -
 56
56 -
 57
57 -
 58
58 -
 59
59 -
 60
60 -
 61
61 -
 62
62 -
 63
63 -
64
-
65
-
66
-
67
-
68
-
69
-
70
-
71
-
72
-
73
-
74
-
75
-
76
-
77
-
78
-
79
-
80
-
81
-
82
-
83
-
84
-
85
-
86
-
87
-
88
-
89
-
90
-
91
-
92
-
93
-
94
-
95
-
96
-
97
-
98
-
99
-
100
-
101
-
102
-
103
-
104
-
105
-
106
-
107
-
108
-
109
-
110
-
111
-
112
-
113
-
114
-
115
-
116
-
117
-
118
-
119
-
120
-
121
-
122
-
123
-
124
-
125
-
126
-
127
-
128
-
129
-
130
-
131
-
132
-
133
-
134
-
135
-
136
-
137
-
138
-
139
-
140
 |
 |

management’s discussion and analsis
GE 2010 ANNUAL REPORT 51
loan-to-value ratios of 83% and 60%, respectively. About 3% of
these loans are without mortgage insurance and have a rein-
dexed loan-to-value ratio equal to or greater than 100%.
Loan-to-value information is updated on a quarterly basis for a
majority of our loans and considers economic factors such as
the housing price index. At December 31, 2010, we had in repos-
session stock approximately 700 houses in the U.K., which had a
value of approximately $0.1 billion. The ratio of nonearning
receivables as a percent of financing receivables increased from
7.9% at January 1, 2010, to 8.4% at December 31, 2010, primarily
due to reduced originations across all platforms.
CONSUMER—NON-U.S. INSTALLMENT AND REVOLVING CREDIT.
Nonearning receivables of $0.3 billion represented 2.5% of
total nonearning receivables at December 31, 2010. The ratio of
allowance for losses as a percent of nonearning receivables
increased from 272.9% at January 1, 2010, to 325.9% at
December 31, 2010, reflecting changes in business mix following
the reclassification of nonearning receivables to assets of busi-
nesses held for sale following our commitment in 2010 to sell
our Consumer businesses in Argentina, Brazil and Canada.
CONSUMER—U.S. INSTALLMENT AND REVOLVING CREDIT.
Nonearning receivables of $1.2 billion represented 10.4% of
total nonearning receivables at December 31, 2010. The ratio
of allowance for losses as a percent of nonearning receivables
remained consistent at approximately 194.2%. The ratio of
nonearning receivables as a percentage of financing receivables
decreased from 3.7% at January 1, 2010, to 2.7% at
December 31, 2010, primarily due to lower delinquencies
reflecting an improvement in the overall credit environment.
Nonaccrual Financing Receivables
The following table provides details related to our nonaccrual
and nonearning financing receivables. Nonaccrual financing
receivables include all nonearning receivables and are those on
which we have stopped accruing interest. We stop accruing
interest at the earlier of the time at which collection becomes
doubtful or the account becomes 90 days past due. Substan-
tially all of the differences between nonearning and nonaccrual
financing receivables relate to loans which are classified as
nonaccrual financing receivables but are paying on a cash
accounting basis, and therefore excluded from nonearning
receivables. Of our $21.4 billion nonaccrual loans at December 31,
2010, $9.3 billion are currently paying in accordance with their
contractual terms.
Nonaccrual
financing Nonearning
December 31, 2010 (In millions) receivables receivables
Commercial
CLL $ 5,246 $ 4,226
Energy Financial Services 78 62
GECAS — —
Other 139 102
Total Commercial 5,463 4,390
Real Estate 9,719 1,347
Consumer 6,211 5,829
Total $21,393 $11,566
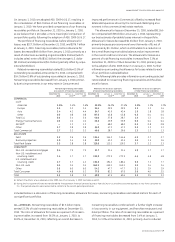
Impaired Loans
“Impaired” loans in the table below are defined as larger-balance
or restructured loans for which it is probable that the lender will
be unable to collect all amounts due according to original con-
tractual terms of the loan agreement. The vast majority of our
Consumer and a portion of our CLL nonaccrual receivables are
excluded from this definition, as they represent smaller-balance
homogeneous loans that we evaluate collectively by portfolio
for impairment.
Impaired loans include nonearning receivables on larger-
balance or restructured loans, loans that are currently paying
interest under the cash basis (but are excluded from the non-
earning category), and loans paying currently but which have
been previously restructured.
Specific reserves are recorded for individually impaired loans
to the extent we have determined that it is probable that we will
be unable to collect all amounts due according to original con-
tractual terms of the loan agreement. Certain loans classified as
impaired may not require a reserve because we believe that we
will ultimately collect the unpaid balance (through collection or
collateral repossession).
Further information pertaining to loans classified as impaired
and specific reserves is included in the table below.
At
December 31, January 1, December 31,
(In millions) 2010 2010
(a) 2009
LOANS REQUIRING ALLOWANCE
FOR LOSSES
Commercial (b) $ 2,733 $ 2,853 $ 2,876
Real Estate 6,812 5,339 5,284
Consumer 2,448 1,300 936
Total loans requiring
allowance for losses 11,993 9,492 9,096
LOANS EXPECTED TO
BE FULLY RECOVERABLE
Commercial (b) 3,087 2,232 2,110
Real Estate 3,005 1,284 1,234
Consumer 106 397 397
Total loans expected to
be fully recoverable 6,198 3,913 3,741
TOTAL IMPAIRED LOANS $18,191 $13,405 $12,837
ALLOWANCE FOR LOSSES
(SPECIFIC RESERVES)
Commercial (b) $ 1,031 $ 1,031 $ 1,073
Real Estate 1,150 1,038 1,017
Consumer 555 301 235
Total allowance for
losses (specific reserves) $ 2,736 $ 2,370 $ 2,325
Average investment
during the period $15,543 (d) $ 8,462
Interest income earned
while impaired (c) 392
(d) 219
(a) Reflects the effects of our adoption of ASU 2009-16 & 17 on January 1, 2010.
See Notes 6 and 23.
(b) Includes CLL, Energy Financial Services, GECAS and Other.
(c) Recognized principally on a cash basis for the years ended December 31, 2010
and 2009, respectively.
(d) Not applicable.