GE 2010 Annual Report Download - page 45
Download and view the complete annual report
Please find page 45 of the 2010 GE annual report below. You can navigate through the pages in the report by either clicking on the pages listed below, or by using the keyword search tool below to find specific information within the annual report.-
 1
1 -
2
-
3
-
4
-
5
-
6
-
7
-
8
-
9
-
10
-
11
-
12
-
13
-
14
-
15
-
16
-
17
-
18
-
19
-
20
-
21
-
22
-
23
-
24
-
25
-
26
-
27
-
28
-
29
-
30
-
31
-
32
-
33
-
34
-
 35
35 -
 36
36 -
 37
37 -
 38
38 -
 39
39 -
 40
40 -
 41
41 -
 42
42 -
 43
43 -
 44
44 -
 45
45 -
 46
46 -
 47
47 -
 48
48 -
 49
49 -
 50
50 -
 51
51 -
 52
52 -
 53
53 -
 54
54 -
 55
55 -
56
-
57
-
58
-
59
-
60
-
61
-
62
-
63
-
64
-
65
-
66
-
67
-
68
-
69
-
70
-
71
-
72
-
73
-
74
-
75
-
76
-
77
-
78
-
79
-
80
-
81
-
82
-
83
-
84
-
85
-
86
-
87
-
88
-
89
-
90
-
91
-
92
-
93
-
94
-
95
-
96
-
97
-
98
-
99
-
100
-
101
-
102
-
103
-
104
-
105
-
106
-
107
-
108
-
109
-
110
-
111
-
112
-
113
-
114
-
115
-
116
-
117
-
118
-
119
-
120
-
121
-
122
-
123
-
124
-
125
-
126
-
127
-
128
-
129
-
130
-
131
-
132
-
133
-
134
-
135
-
136
-
137
-
138
-
139
-
140
 |
 |

management’s discussion and analsis
GE 2010 ANNUAL REPORT 43
operations, we sell certain real estate equity investments when
it is economically advantageous for us to do so. Depreciation
expense on real estate equity investments totaled $1.2 billion in
both 2009 and 2008.
Energy Financial Services 2010 revenues decreased 8% and
net earnings increased 73% compared with 2009. Revenues in
2010 included a $0.1 billion gain related to the Regency trans-
action and in 2009 were reduced by $0.1 billion of gains from
dispositions. Revenues in 2010 decreased compared with 2009 as
a result of organic revenue growth ($0.4 billion), primarily
increases in associated company revenues resulting from an
asset sale by an investee ($0.2 billion), more than offset by the
deconsolidation of Regency. The increase in net earnings resulted
primarily from core increases ($0.1 billion), primarily increases in
associated company earnings resulting from an asset sale by an
investee ($0.2 billion) and the gain related to the Regency trans-
action ($0.1 billion).
Energy Financial Services 2009 revenues decreased 43% and
net earnings decreased 74% compared with 2008. Revenues in
2009 included $0.1 billion of gains from dispositions. Revenues
in 2009 also decreased $1.7 billion compared with 2008 as a
result of organic declines ($1.7 billion), primarily as a result of
the effects of lower energy commodity prices and a decrease in
gains on sales of assets. The decrease in net earnings resulted
primarily from core declines, including a decrease in gains on
sales of assets as compared to the prior period and the effects
of lower energy commodity prices.
GECAS 2010 revenues increased 12% and net earnings
increased 18% compared with 2009. Revenues in 2010 increased
compared with 2009 as a result of organic revenue growth
($0.5 billion), including higher investment income. The increase in
net earnings resulted primarily from core increases ($0.2 billion),
including the benefit from resolution of the 2003–2005 IRS audit,
lower credit losses and higher investment income, partially offset
by higher impairments related to our operating lease portfolio of
commercial aircraft.
GECAS 2009 revenues decreased 2% and net earnings
decreased 11% compared with 2008. The decrease in revenues
resulted primarily from lower asset sales ($0.2 billion). The
decrease in net earnings resulted primarily from lower asset sales
($0.1 billion) and core declines reflecting higher credit losses
and impairments.
HOME & BUSINESS SOLUTIONS revenues increased 2%, or
$0.2 billion, to $8.6 billion in 2010 compared with 2009 as higher
volume ($0.4 billion) and higher other income ($0.1 billion) was
partially offset by lower prices ($0.2 billion). The increase in
volume reflected increased sales across all businesses. The
decrease in price was primarily at Appliances. Segment profit
increased 24%, or $0.1 billion, to $0.5 billion in 2010, primarily
as a result of the effects of productivity ($0.2 billion) and
increased other income primarily related to associated com-
panies ($0.1 billion), partially offset by lower prices ($0.2 billion).
Home & Business Solutions revenues of $8.4 billion decreased
17%, or $1.7 billion, in 2009 compared with 2008, as lower volume
($1.8 billion) and the stronger U.S. dollar ($0.1 billion) were partially
offset by higher prices ($0.2 billion). The decrease in volume pri-
marily reflected tightened consumer spending in the European
and U.S. markets. Segment profit increased 1% in 2009 as higher
prices ($0.2 billion) and lower material and other costs ($0.2 billion)
were partially offset by lower productivity ($0.2 billion) and lower
other income ($0.1 billion). See Corporate Items and Eliminations
for a discussion of items not allocated to this segment.
CORPORATE ITEMS AND ELIMINATIONS
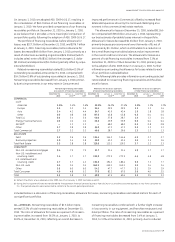
(In millions) 2010 2009 2008
REVENUES
Security and other
disposed businesses $ 298 $ 1,765 $ 1,784
Insurance activities 3,596 3,383 3,226
Eliminations and other (1,646) (2,660) (2,811)
Total $ 2,248 $ 2,488 $ 2,199
OPERATING PROFIT (COST)
Security and other
disposed businesses $ 5 $ 190 $ 270
Insurance activities (58) (79) (213)
Principal pension plans (1,072) (547) (244)
Underabsorbed
corporate overhead (593) (361) (341)
Other (1,603) (2,029) (1,381)
Total $(3,321) $(2,826) $(1,909)
Corporate Items and Eliminations include the effects of eliminat-
ing transactions between operating segments; certain disposed
businesses, including our Security business; results of our insur-
ance activities remaining in continuing operations; cost of our
principal pension plans; under absorbed corporate overhead; and
certain non-allocated amounts described below. Corporate
Items and Eliminations is not an operating segment. Rather, it is
added to operating segment totals to reconcile to consolidated
totals on the financial statements.
Certain amounts included in Corporate Items and Eliminations
cost are not allocated to GE operating segments because they are
excluded from the measurement of their operating performance
for internal purposes. In 2010, these included $0.5 billion at
Technology Infrastructure and $0.3 billion at Energy Infrastructure,
primarily for technology and product development costs, restruc-
turing, rationalization and other charges, and $0.3 billion at
Home & Business Solutions and $0.1 billion at NBC Universal,
primarily for restructuring, rationalization and other charges. In
2009, these included $0.3 billion at both Technology Infrastructure
and Energy Infrastructure and $0.2 billion at Home & Business
Solutions, primarily for restructuring, rationalization and other
charges and $0.3 billion at NBC Universal, primarily for restructur-
ing, rationalization and other charges and technology and product
development costs. In 2008, amounts primarily related to restruc-
turing, rationalization and other charges were $0.5 billion at
NBC Universal, $0.4 billion at Technology Infrastructure and
$0.3 billion at each of Energy Infrastructure and Home & Business
Solutions. Included in these amounts in 2008 were technology and
product development costs of $0.2 billion at NBC Universal and
$0.1 billion at Technology Infrastructure.