GE 2010 Annual Report Download - page 116
Download and view the complete annual report
Please find page 116 of the 2010 GE annual report below. You can navigate through the pages in the report by either clicking on the pages listed below, or by using the keyword search tool below to find specific information within the annual report.-
 1
1 -
2
-
3
-
4
-
5
-
6
-
7
-
8
-
9
-
10
-
11
-
12
-
13
-
14
-
15
-
16
-
17
-
18
-
19
-
20
-
21
-
22
-
23
-
24
-
25
-
26
-
27
-
28
-
29
-
30
-
31
-
32
-
33
-
34
-
35
-
36
-
37
-
38
-
39
-
40
-
41
-
42
-
43
-
44
-
45
-
46
-
47
-
48
-
49
-
50
-
51
-
52
-
53
-
54
-
55
-
56
-
57
-
58
-
59
-
60
-
61
-
62
-
63
-
64
-
65
-
66
-
67
-
68
-
69
-
70
-
71
-
72
-
73
-
74
-
75
-
76
-
77
-
78
-
79
-
80
-
81
-
82
-
83
-
84
-
85
-
86
-
87
-
88
-
89
-
90
-
91
-
92
-
93
-
94
-
95
-
96
-
97
-
98
-
99
-
100
-
101
-
102
-
103
-
104
-
105
-
 106
106 -
 107
107 -
 108
108 -
 109
109 -
 110
110 -
 111
111 -
 112
112 -
 113
113 -
 114
114 -
 115
115 -
 116
116 -
 117
117 -
 118
118 -
 119
119 -
 120
120 -
 121
121 -
 122
122 -
 123
123 -
 124
124 -
 125
125 -
 126
126 -
127
-
128
-
129
-
130
-
131
-
132
-
133
-
134
-
135
-
136
-
137
-
138
-
139
-
140
 |
 |

114 GE 2010 ANNUAL REPORT
The amounts related to the change in the fair value of the forward
points that are excluded from the measure of effectiveness were
$(906) million and $(899) million for the years ended December 31,
2010 and 2009, respectively, and are recorded in interest and
other financial charges.
FREE-STANDING DERIVATIVES
Changes in the fair value of derivatives that are not designated as
hedges are recorded in earnings each period. As discussed above,
these derivatives are typically entered into as economic hedges of
changes in interest rates, currency exchange rates, commodity
prices and other risks. Gains or losses related to the derivative are
typically recorded in GECS revenues from services or other
income, based on our accounting policy. In general, the earnings
effects of the item that represent the economic risk exposure are
recorded in the same caption as the derivative. Losses for the
year ended December 31, 2010 on derivatives not designated as
hedges were $(302) million comprised of amounts related to
interest rate contracts of $185 million, currency exchange con-
tracts of $(666) million, and other derivatives of $179 million.
These losses were more than offset by the earnings effects from
the underlying items that were economically hedged. Gains for
the year ended December 31, 2009 on derivatives not designated
as hedges, without considering the offsetting earnings effects
from the item representing the economic risk exposure, were
$1,021 million comprised of amounts related to interest rate
contracts of $211 million, currency exchange contracts of
$499 million, and other derivatives of $311 million.
COUNTERPARTY CREDIT RISK
Fair values of our derivatives can change significantly from period
to period based on, among other factors, market movements and
changes in our positions. Accordingly, we actively monitor these
exposures and take appropriate actions in response. We manage
counterparty credit risk (the risk that counterparties will default
and not make payments to us according to the terms of our
standard master agreements) on an individual counterparty basis.
Where we have agreed to netting of derivative exposures with a
counterparty, we offset our exposures with that counterparty and
apply the value of collateral posted to us to determine the expo-
sure. When net exposure to a counterparty, based on the current
market values of agreements and collateral, exceeds credit expo-
sure limits (see following table), we typically take action to reduce
such exposures. These actions may include prohibiting additional
transactions with the counterparty, requiring additional collateral
from the counterparty (as described below) and terminating or
restructuring transactions.
As discussed above, we have provisions in certain of our
master agreements that require counterparties to post collateral
(typically, cash or U.S. Treasuries) when our receivable due from
the counterparty, measured at current market value, exceeds a
specified limit. At December 31, 2010, our exposure to counter-
parties, including interest due, net of collateral we hold, was
$1,232 million. The fair value of such collateral was $7,689 million,
of which $2,112 million was cash and $5,577 million was in the
into earnings contemporaneously and in the same caption with
the earnings effects of the hedged transaction.
The following table provides information about the amounts
recorded in AOCI, as well as the gain (loss) recorded in earnings,
primarily in interest and other financial charges, when reclassified
out of AOCI, for the years ended December 31, 2010 and 2009.
Gain (loss) recognized Gain (loss) reclassified from
Year ended in AOCI
AOCI into earnings
December 31 (In millions) 2010 2009 2010 2009
CASH FLOW HEDGES
Interest rate contracts $ (571) $ (854) $(1,356) $(2,047)
Currency exchange
contracts (550) 2,579 (445) 972
Commodity contracts 10 (5) 2 (5)
Total $(1,111) $1,720 $(1,799) $(1,080)
The total pre-tax amount in AOCI related to cash flow hedges of forecasted
transactions was $1,941 million at December 31, 2010. We expect to transfer
$(1,004) million to earnings as an expense in the next 12 months contemporaneously
with the earnings effects of the related forecasted transactions. In 2010, we
recognized insignificant gains and losses related to hedged forecasted transactions
and firm commitments that did not occur by the end of the originally specified period.
At December 31, 2010 and 2009, the maximum term of derivative instruments that
hedge forecasted transactions was 25 years and 26 years, respectively, and related to
hedges of anticipated interest payments associated with external debt.
For cash flow hedges, the amount of ineffectiveness in the hedg-
ing relationship and amount of the changes in fair value of the
derivatives that are not included in the measurement of ineffec-
tiveness are both reflected in earnings each reporting period.
These amounts are primarily reported in GECS revenues from
services and totaled $19 million and $49 million for the years
ended December 31, 2010 and 2009, respectively, of which
$(18) million represents amounts excluded from the assessment
of effectiveness for the year ended December 31, 2009.
Net investment hedges in foreign operations
We use currency exchange derivatives to protect our net invest-
ments in global operations conducted in non-U.S. dollar
currencies. For derivatives that are designated as hedges of net
investment in a foreign operation, we assess effectiveness based
on changes in spot currency exchange rates. Changes in spot
rates on the derivative are recorded as a component of AOCI until
such time as the foreign entity is substantially liquidated or sold.
The change in fair value of the forward points, which reflects the
interest rate differential between the two countries on the deriva-
tive, is excluded from the effectiveness assessment.
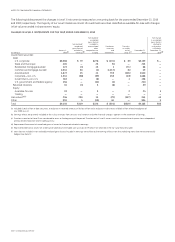
The following table provides information about the amounts
recorded in AOCI for the years ended December 31, 2010 and
2009, as well as the gain (loss) recorded in GECS revenues from
services when reclassified out of AOCI.
Gain (loss) recognized Gain (loss) reclassified
Year ended in CTA
from CTA
December 31 (In millions) 2010 2009 2010 2009
NET INVESTMENT HEDGES
Currency exchange
contracts $(2,023) $(6,240) $(38) $(84)