GE 2010 Annual Report Download - page 134
Download and view the complete annual report
Please find page 134 of the 2010 GE annual report below. You can navigate through the pages in the report by either clicking on the pages listed below, or by using the keyword search tool below to find specific information within the annual report.-
 1
1 -
2
-
3
-
4
-
5
-
6
-
7
-
8
-
9
-
10
-
11
-
12
-
13
-
14
-
15
-
16
-
17
-
18
-
19
-
20
-
21
-
22
-
23
-
24
-
25
-
26
-
27
-
28
-
29
-
30
-
31
-
32
-
33
-
34
-
35
-
36
-
37
-
38
-
39
-
40
-
41
-
42
-
43
-
44
-
45
-
46
-
47
-
48
-
49
-
50
-
51
-
52
-
53
-
54
-
55
-
56
-
57
-
58
-
59
-
60
-
61
-
62
-
63
-
64
-
65
-
66
-
67
-
68
-
69
-
70
-
71
-
72
-
73
-
74
-
75
-
76
-
77
-
78
-
79
-
80
-
81
-
82
-
83
-
84
-
85
-
86
-
87
-
88
-
89
-
90
-
91
-
92
-
93
-
94
-
95
-
96
-
97
-
98
-
99
-
100
-
101
-
102
-
103
-
104
-
105
-
106
-
107
-
108
-
109
-
110
-
111
-
112
-
113
-
114
-
115
-
116
-
117
-
118
-
119
-
120
-
121
-
122
-
123
-
 124
124 -
 125
125 -
 126
126 -
 127
127 -
 128
128 -
 129
129 -
 130
130 -
 131
131 -
 132
132 -
 133
133 -
 134
134 -
 135
135 -
 136
136 -
 137
137 -
 138
138 -
 139
139 -
 140
140
 |
 |

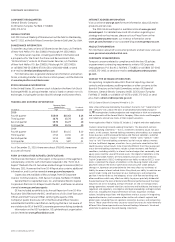
132 GE 2010 ANNUAL REPORT
Our ROTC calculation excludes earnings (losses) of discontinued
operations from the numerator because U.S. GAAP requires us to
display those earnings (losses) in the Statement of Earnings. Our
calculation of average GE shareowners’ equity may not be directly
comparable to similarly titled measures reported by other compa-
nies. We believe that it is a clearer way to measure the ongoing
trend in return on total capital for the continuing operations of
our businesses given the extent that discontinued operations
have affected our reported results. We believe that this results in
a more relevant measure for management and investors to evalu-
ate performance of our continuing operations, on a consistent
basis, and to evaluate and compare the performance of our con-
tinuing operations with the ongoing operations of other
businesses and companies.
Definitions indicating how the above-named ratios are calcu-
lated using average GE shareowners’ equity, excluding effects of
discontinued operations, can be found in the Glossary.
Ratio of Debt to Equity at GECS, Net of Cash and Equivalents
and with Classification of Hybrid Debt as Equity
December 31 (Dollars in millions) 2010 2009 2008
GECS debt $470,562 $493,585 $514,430
Less cash and equivalents 60,272 62,584 37,411
Less hybrid debt 7,725 7,725 7,725
$402,565 $423,276 $469,294
GECS equity $ 68,984 $ 70,833 $ 53,279
Plus hybrid debt 7,725 7,725 7,725
$ 76,709 $ 78,558 $ 61,004
Ratio 5.25:1 5.39:1 7.69:1
Ratio of Debt to Equity at GECC, Net of Cash and Equivalents
and with Classification of Hybrid Debt as Equity
December 31 (Dollars in millions) 2010 2009
GECC debt $465,350 $490,707
Less cash and equivalents 59,553 61,923
Less hybrid debt 7,725 7,725
$398,072 $421,059
GECC equity $ 72,881 $ 73,718
Plus hybrid debt 7,725 7,725
$ 80,606 $ 81,443
Ratio 4.94:1 5.17:1
We have provided the GECS and GECC ratio of debt to equity on a
basis that reflects the use of cash and equivalents to reduce debt,
and with long-term debt due in 2066 and 2067 classified as
equity. We believe that this is a useful comparison to a GAAP-
based ratio of debt to equity because cash balances may be used
to reduce debt and because this long-term debt has equity-like
characteristics. The usefulness of this supplemental measure may
be limited, however, as the total amount of cash and equivalents
at any point in time may be different than the amount that could
practically be applied to reduce outstanding debt, and it may not
be advantageous or practical to replace certain long-term debt
with equity. In the first quarter of 2009, GE made a $9.5 billion
payment to GECS (of which $8.8 billion was further contributed to
GECC through capital contribution and share issuance). Despite
these potential limitations, we believe that this measure, consid-
ered along with the corresponding GAAP measure, provides
investors with additional information that may be more compa-
rable to other financial institutions and businesses.
Average GE Shareowners’ Equity, Excluding Effects of Discontinued Operations(a)
December 31 (In millions) 2010 2009 2008 2007 2006
Average GE shareowners’ equity(b) $116,179 $110,535 $113,387 $113,809 $109,142
Less the effects of the average net investment in
discontinued operations 5,314 6,125 2,287 6,181 8,707
Average GE shareowners’ equity, excluding effects of
discontinued operations(a) $110,865 $104,410 $111,100 $107,628 $100,435
(a) Used for computing return on average GE shareowners’ equity and return on average total capital invested (ROTC).
(b) On an annual basis, calculated using a five-point average.