GE 2010 Annual Report Download - page 128
Download and view the complete annual report
Please find page 128 of the 2010 GE annual report below. You can navigate through the pages in the report by either clicking on the pages listed below, or by using the keyword search tool below to find specific information within the annual report.-
 1
1 -
2
-
3
-
4
-
5
-
6
-
7
-
8
-
9
-
10
-
11
-
12
-
13
-
14
-
15
-
16
-
17
-
18
-
19
-
20
-
21
-
22
-
23
-
24
-
25
-
26
-
27
-
28
-
29
-
30
-
31
-
32
-
33
-
34
-
35
-
36
-
37
-
38
-
39
-
40
-
41
-
42
-
43
-
44
-
45
-
46
-
47
-
48
-
49
-
50
-
51
-
52
-
53
-
54
-
55
-
56
-
57
-
58
-
59
-
60
-
61
-
62
-
63
-
64
-
65
-
66
-
67
-
68
-
69
-
70
-
71
-
72
-
73
-
74
-
75
-
76
-
77
-
78
-
79
-
80
-
81
-
82
-
83
-
84
-
85
-
86
-
87
-
88
-
89
-
90
-
91
-
92
-
93
-
94
-
95
-
96
-
97
-
98
-
99
-
100
-
101
-
102
-
103
-
104
-
105
-
106
-
107
-
108
-
109
-
110
-
111
-
112
-
113
-
114
-
115
-
116
-
117
-
 118
118 -
 119
119 -
 120
120 -
 121
121 -
 122
122 -
 123
123 -
 124
124 -
 125
125 -
 126
126 -
 127
127 -
 128
128 -
 129
129 -
 130
130 -
 131
131 -
 132
132 -
 133
133 -
 134
134 -
 135
135 -
 136
136 -
 137
137 -
 138
138 -
139
-
140
 |
 |

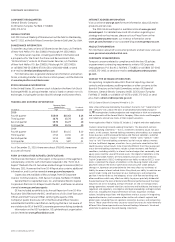
126 GE 2010 ANNUAL REPORT
Certain supplemental information related to GE and GECS cash flows is shown below.
December 31 (In millions) 2010 2009 2008
GE
NET DISPOSITIONS (PURCHASES) OF GE SHARES FOR TREASURY
Open market purchases under share repurchase program $ (1,715) $ (85) $ (3,222)
Other purchases (77) (129) (286)
Dispositions 529 837 2,259
$ (1,263) $ 623 $ (1,249)
GECS
ALL OTHER OPERATING ACTIVITIES
Net change in other assets $ 28 $ (344) $ (1,370)
Amortization of intangible assets 654 906 981
Realized losses on investment securities 91 473 1,260
Cash collateral on derivative contracts — (6,858) 7,769
Change in other liabilities (3,397) (4,919) (3,238)
Other 4,486 578 3,248
$ 1,862 $ (10,164) $ 8,650
NET DECREASE (INCREASE) IN GECS FINANCING RECEIVABLES
Increase in loans to customers $(310,581) $(278,536) $(409,308)
Principal collections from customers—loans 331,214 283,743 361,384
Investment in equipment for financing leases (10,225) (9,509) (21,671)
Principal collections from customers—financing leases 15,118 17,460 20,159
Net change in credit card receivables (4,559) (28,534) (34,691)
Sales of financing receivables 5,331 58,555 67,093
$ 26,298 $ 43,179 $ (17,034)
ALL OTHER INVESTING ACTIVITIES
Purchases of securities by insurance activities $ (1,712) $ (3,106) $ (4,190)
Dispositions and maturities of securities by insurance activities 3,136 3,962 4,690
Other assets—investments 2,690 (258) (228)
Change in other receivables 482 821 3,313
Other 2,805 (2,655) 2,867
$ 7,401 $ (1,236) $ 6,452
NEWLY ISSUED DEBT (MATURITIES LONGER THAN 90 DAYS)
Short-term (91 to 365 days) $ 2,496 $ 5,801 $ 34,445
Long-term (longer than one year) 35,474 75,216 81,614
Proceeds—non-recourse, leveraged leases — 48 113
$ 37,970 $ 81,065 $ 116,172
REPAYMENTS AND OTHER REDUCTIONS (MATURITIES LONGER THAN 90 DAYS)
Short-term (91 to 365 days) $ (95,170) $ (77,444) $ (65,958)
Long-term (longer than one year) (1,792) (5,217) (462)
Principal payments—non-recourse, leveraged leases (638) (680) (637)
$ (97,600) $ (83,341) $ (67,057)
ALL OTHER FINANCING ACTIVITIES
Proceeds from sales of investment contracts $ 5,339 $ 7,840 $ 11,433
Redemption of investment contracts (8,647) (10,713) (13,304)
Other (9) 182 9
$ (3,317) $ (2,691) $ (1,862)